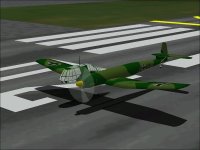
Blohm & Voss BV 141B-0

Instrument Panels

Hello Aleatorylamp,

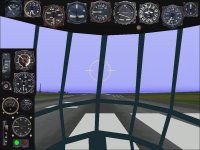
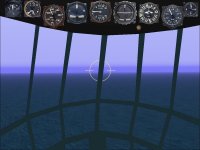
Above the front glass is a row of indicator dials which could be considered the main "Panel".
That part is already done though the background could use a few edits.

The problem is that there are many more instruments that are "essential" for a CFS aeroplane.

There is the Throttle panel which would have a Throttle of course and also have (in this case) a Propeller Pitch control.

There would have to be at least one more "Sub Panel" to hold other gauges such as
Fuel Switch
Fuel Quantity Gauge <--- New!
Elevator Trim Gauge <--- New
Magnetos <--- Conspicuously absent from the stock FW 190A
Landing Gear control / indicator
Flap Control

I still need to create a background for this sub panel and make sure I did not leave anything out.

- Ivan.
 
Hello Ivan,
OK, I get the point about the complicated instrument layout.

I guess it is difficult to decide how to put in the other instruments that are not on the main, slim, overhead panel, and which of these to have together on the main panel, and which to put on a separate sub-panel.

I´m just musing, not telling you what to do. I´m sure you understand:
As you must have also seen, there was a shelf running along the left side of the glazed canopy, containing Thrust and Propeller-Pitch levers, also Flap and Trim, and strangely enough, also Starter and Ignition switches, RPM, Boost and Fuel gauges, amongst others... I can´t see the landing gear lever, except an emergency one in the middle behind the pilot.
Then, the compass was infront of the rudder pedals, rather low down, on a window strut, with the bomb-sight a little to the right, nearer to the pilot. Maybe all this to be put on the main panel.

The whole thing seems to be an exercise in perspective drawing!

Radio equipment was on the right, further back, so this would definitely be a candidate for a sub-panel.

I agree, a difficult and strange layout indeed. I hope you can get it to your liking!
Cheers,
Aleatorylamp
 
Hello Aleatorylamp,

As with any other kind of project, it is a matter of staying with some established game standards while retaining some of the characteristic appearance of the particular aeroplane.
The BV 141B used the same BMW 801 engine as the FW 190A, but apparently had a Propeller control while the FW 190A did not.
That would imply that there was no Kommandogerat or that it operated in a different manner from that of the FW 190A.
Real aircraft controls sometimes are tucked into odd places, but it doesn't make sense to have a great number of sub panels each with only a single dial or lever.
It also doesn't make sense to put both a Compass on the Window Frame and a Directional Gyro above the Windscreen because for CFS purposes, they both do the same thing.
I was planning on programming a Bomb Sight eventually, but this panel won't have it until I actually do it.
There also won't be a Radio Panel on this release or even an Autopilot.

The problem I am trying to figure out is how to put the Trim Gauge on a sub panel at a reasonable size and yet make it possible to see it well enough to read the number of notches of Trim.

- Ivan.
 
Propellers and Stuff

A few days ago, I thought the BV 141B AIR File was pretty close to done.
I just needed to do a bit of testing and documentation to confirm that there was no unexpected strange behaviour.

The testing went pretty well with numbers falling well within range of where I wanted them.
One somewhat odd thing I noticed was that the BV 141B was able to maintain very near its maximum speed (tested at 2550 RPM) at an unusually great altitude range.
It was able to reach 280 MPH at 15,000 feet but even at 22,500 feet, it was still able to hit 276 MPH.

At this point, I was thinking that since I had done all this work with Propeller Tables but have not yet released any of my own projects with non-stock Propeller Tables, the BV 141B would make a good subject.
After all, how bad could it be?

With that in mind, the next step was to go back and record Propeller Pitch Angles and Thrust values for maximum speed at Sea Level and 15,000 feet because all I was planning was to adjust the Efficiency curves down to Zero where the Geometry indicated either Zero or Negative Angles of Attack for the Propeller Blades. Simple!

I went back and recorded the Propeller Pitch Angles for maximum speeds at ALL altitudes so that I could confirm that changes I would be making did not otherwise affect performance.
After a few tests, I started noticing something REALLY strange: Blade Pitch was always 32-35 degrees.

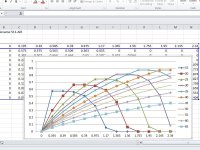
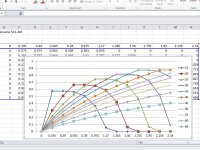
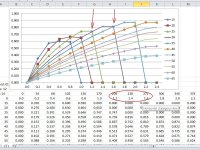
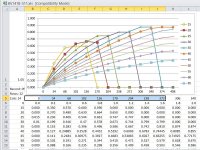
When I dumped the Propeller Efficiency Table to a spreadsheet, graphing it showed that there would be a lot more work than I had expected.
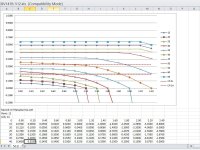
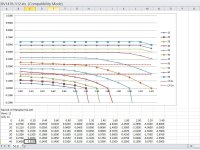
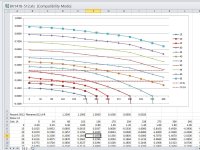
Compare the BV 141B Table 511 to the Table 511 from the Ki 61 and FW 200 Condor.
I believe the general shape of the Ki 61 and Condor Tables are closer to correct.

- Ivan.
 

Attachments

  • BV141B-Table511.jpg
    BV141B-Table511.jpg
    93.8 KB · Views: 1
  • Condor511-ScreenshotV2.jpg
    Condor511-ScreenshotV2.jpg
    120.5 KB · Views: 0
  • Interpolation.jpg
    Interpolation.jpg
    108.1 KB · Views: 0
Hello ivan,
Very interesting indeed! ...and a lot more complicated than a fixed-pitch propeller!
I´m curious to see the final BV 141B propeller!
Cheers,
Aleatorylamp
 
Gathering Propeller Data

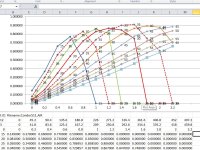
There were two "Obviously" bad things about the original Propeller Efficiency Graph:

The first issue was that the efficiency curve for 15 degrees was very strangely shaped,
(That was not difficult to correct, but the assumption is that we will need to re visit to fine tune later.

The second issue and the main reason for wanting to edit the Propeller Tables to begin with was that even for very shallow pitch angles, the efficiency did not drop to Zero fast enough with increasing Advance Ratio.

Both issues were "Addressed".

At this point (and probably earlier) it made sense to gather a few numbers to figure out how these Propeller Tables fit in with the Aircraft's speed ranges.

(I used data from the FW 190A when I could not find specific data for the BV 141B.)
Propeller Diameter 3.30 Meters
Reduction Gear 24:13
Pitch Range 23-65 Degrees

Maximum RPM 2700 for Take-Off
Normal Maximum RPM 2550 which was used for speed testing.

Advance Ratio 1.0 = 170 MPH.

When I found the Propeller Pitch Range, it became obvious that the 15 degree graphs in the Propeller Tables served no purpose at all other than as a distraction.
The entire level speed range at 2550 RPM is between Advance Ratio 1.2 and Advance Ratio 1.6.

It also became obvious that just changing the Propeller Efficiency Graph (Table 511) would not work because the current Power Coefficient Graph (Table 512) currently selects a propeller pitch somewhere between 27 degrees and 34 degrees depending on altitude.
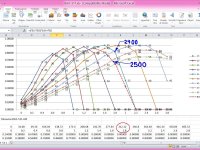
27 degrees at 227 MPH would be hitting the very steep drop as propeller efficiency dropped off.
34 degrees at 280 MPH would actually be fairly reasonable though.

Next step will be to try adjusting the Power Coefficient Graph in an attempt run slightly higher pitch at each Advance Ratio.

- Ivan.
 

Attachments

  • BV141B-Table511.jpg
    BV141B-Table511.jpg
    93.8 KB · Views: 0
  • BV141B-Table511-Annotated.jpg
    BV141B-Table511-Annotated.jpg
    114.3 KB · Views: 0
Propellers

Hello Aleatorylamp,

I am fairly certain that you are not asking the questions that you really meant to ask.
The problem is that we have already been discussing this propeller business on at least four of your projects and have covered several times the issues that you are bringing up now, so I am not sure what you actually understood and what you did not.

Aleatorylamp said:
I´m trying to use the Beckwith .pdf document propeller formulae to calculate exactly where a propeller efficiency graph should drop down to zero, but it´s all a bit foggy as yet, I´m afraid.

Beckwith's document is a pretty good explanation of how the Propeller Tables interact but does not discuss anything about Efficiency dropping to Zero. Note that his graphs are of the stock P51D.
The Efficiency dropping to Zero part is my own reading and calculation with a few assumptions thrown in which I am not certain are entirely correct.
I just know they are more correct than the stock CFS Propeller Graphs but do cause more headaches than just using the stock graphs.
They do, however, avoid the Perpetual Motion business which I will address whenever I actually do a proper Propeller Tutorial.
I am still not entirely confident I know everything I should for such a tutorial yet.

Regarding Advance Ratio and Thrust: I thought you were pretty clear on that with the most recent discussions on the Stearman 75? Those subjects have come up repeated in that thread and I thought you had a good working knowledge there.

Regarding Power Coefficient: This formula is stated in many many aerodynamic texts that can be found online. They can provide a much better explanation than an amateur like myself can provide.
The only thing to watch out for is to make sure that your Units are all correct in such a way that they cancel each other out.
That is what is meant by the Cp value being a dimensionless number.
(The cool thing is that just two days ago, I was explaining this concept of dimensionless number to my Son who is studying this business in Chemistry.)
Look at the numbers I have been giving you for your Stearman 75 project.
I am fairly certain my numbers are correct there, so if you get the same, you have exactly what I have.
I am not trying to be dismissive here; I just put the formula into a Spreadsheet and use it for calculations rather than trying to do unit conversions every time.

Power Coefficient is the same regardless of whether Propeller is Constant Speed or Fixed Pitch as we have been seeing in your Condor Project and in the Stearman Project and even as far back as the Great War Bombers we worked on a while back.
The big difference is what the simulator does with propeller blade pitch when it runs into a lugging or overspeed situation with a Constant Speed propeller.

- Ivan.
 
Hello Aleatorylamp,

You are posting in the wrong thread.
You are a bit off topic here in this thread.
It seems like you really want to discuss your Stearman 75 and there is already a pretty long thread about that project.


Hello Smilo,
For the purposes of continuity, would you please move the last few posts to the Stearman 75 thread.
They make much more sense in the context there whereas in this thread, they just look like a couple non sequiturs.

Thanks.
- Ivan.
 
Power Coefficient Table

Hello All,

Last night, I slightly modified the existing Power Coefficient Graph (Table 512) by changing the point at which each graph reached Zero so that it would coincide with the Propeller Efficiency Graph.
The Graphs were also slightly altered in shape so that they be constantly decreasing instead of sometimes increasing.
The two Red dotted lines represent the Power Coefficients at Maximum Speed at Sea Level and at 15,000 feet.

By simple examination, this Flight Model should be reaching between 40 degrees and 45 degrees Propeller Pitch at Maximum Speed (280 MPH) but testing only showed 34 degrees.

In going through the AIR file, I found incorrect information in the Propeller Parameters in Records 500, and 510:
The Reduction Gear Ratio was specified as 2.000 when the correct value should be 1.84615
The Propeller Diameter was considerably too high at 13.333 feet o 134 inches when it should be 10.82677 feet or 130 inches.
The Propeller Pitch Range was specified in one location as 15-55 degrees and should be 23-65 degrees.

With all those changes, the Thrust is now much lower and the Maximum Speed is a lot lower at both Sea Level and Critical Altitude.
Sea Level ----- 227 MPH to 224 MPH which is not that different
15,000 feet -- 280 MPH to 264 MPH which is way too low

Next step is to go back and adjust the Zero Lift Drag Coefficient to bring the speed up again.
If that does not get things to where they should be, then comes some fine tuning with the Propeller Efficiency Graph which is why I did not spend much time modifying it earlier.

- Ivan.
 

Attachments

  • BV141B-Table512-Edited.jpg
    BV141B-Table512-Edited.jpg
    95.8 KB · Views: 3
Too Easy

....As mentioned earlier, the next step was to adjust the Coefficient of Drag to match speeds at Sea Level and see what that would do to altitude performance and adjust the Propeller Efficiency Graph if necessary.

Adjusting Drag down a bit brought speeds to
232 MPH @ 500 feet
273 MPH @ 15,000 feet

Actual speeds should be
229 MPH @ Sea Level
272 MPH @ 16404 feet (5000 Meters)

Adjusting the Propeller Efficiency Graph was not really necessary, but the 40 and 45 degree graphs did not look right so I adjusted them anyway.

Speed is now
279 MPH @ 15,000 feet
278 MPH @ 16,404 feet

So at this point, we are back again to the testing stage to make sure there are no other strange side effects from using different places in the Propeller Tables.

- Ivan.
 
Misbehaviour

Slightly Off Topic:
One of the things I forgot to mention earlier was that the utility program I had written to translate the Spreadsheet CSV file into the Binary AIR File format behaved badly when I deleted what I had thought was an unnecessary field.
Apparently the program was expecting a Comma as a delimiter and would parse to the NULL Terminator for the String if the Comma was not found.

At some point I should fix the program.to be more tolerant of slight format differences.

- Ivan.
 
Too Easy - Famous Last Words

The Fates and God / Gods punish Hubris and "Too Easy" was quite an arrogant statement!

In conducting a test of the Climb Rate, I was finding that the Propeller Pitch Angle seemed to be not significantly different than it was for high speed and that is a bit unusual.
Looking at the Power Coefficient Graph showed why that was the case.
Note that there are two Red Dotted Lines stretching across the graph horizontally.
Those represent the Power Coefficients at Full Throttle at 2547 RPM at 500 feet and at 15,000 feet.
The Power Coefficient is significantly higher at the higher altitude mostly because the Engine Power is much greater at Critical Altitude.
(N.B.)
Note that the Red Dotted Lines do not cross many of the Graph Lines for the Propeller Pitch Angles.
The upper Red Dotted Line only crosses the 40 degree Pitch Line.

The Climb Rate I was getting was 1300 feet / minute at about 150 MPH IAS.
In looking at the Propeller Efficiency Graph, it was obvious that a coarser and less efficient pitch was being selected than was optimal.
The real life equivalent was that the Propeller Constant Speed Unit was set incorrectly or that the Propeller Blades were too small to absorb all the power the Engine was supplying.

After a LOT of adjustments, the Pitch selection is better though still not perfect and Climb Rate increased to 1500 feet / minute.

The Before and After Graphs are both attached for Comparison.
At a casual glance, there may not appear to be much difference, but some of these curves are as precise in their effect as a fingerprint is distinctive..... And others (50 degrees through 65 degree) serve mostly as place holders and are mostly irrelevant.

.......
 

Attachments

  • BV141B-Table512-Edited.jpg
    BV141B-Table512-Edited.jpg
    95.8 KB · Views: 0
  • BV141B-Table512-BigChanges.jpg
    BV141B-Table512-BigChanges.jpg
    97.7 KB · Views: 0
More Not so Easy Stuff

After tuning the Power Coefficient Graph (Table 512), a check of the Propeller Efficiency Graph (Table 511) showed that the differences in efficiency some of the pitch angles appeared to be too great.
Some of the curve were very slightly adjusted to increase Thrust in some areas and reduce Thrust in others.
The main intent was slightly increase the climb rate and to bring the speed for best climb down from 150 MPH to about 132 MPH (Data for actual Aircraft).

The updated Propeller Efficiency Graph is attached.
Note that the Graph Line for 15 degrees is now Yellow to be less obvious.
(It isn't used anyway!)
Note also that I changed the scale to show the Level Speed instead of Advance Ratio because it was the more intuitive number to use for tuning.

The net effect was to increase the climb rate to about 1600 feet / minute at low altitude and 1700 feet / minute at around 8,000 to 12,000 feet.
Instead of bringing the speed for best climb down, the speed range for best climb was widened so that 1600 feet / minute can be maintained anywhere from about 145 MPH to 160 MPH.

After all the Propeller Tuning, Engine Power had not changed, but Thrust was significantly higher.
Drag had to be increased to bring level speed back down to the proper range:

232 MPH @ 500 feet
276 MPH @ 15,000 feet
277 MPH @ 16,400 feet

As mentioned before, all speed and climb testing was done at 2550 RPM (really 2547 RPM) so I was curious as to what would happen at 2700 RPM.
It turned out not to be very different:

280 MPH @ 16,400 feet

For the Service Ceiling Test, results were not nearly as clear.
Service Ceiling is documented as 10,000 Meters.

With 50% Fuel and Full Ammunition and No Bombs,
Testing showed either 400 feet too low or 900 feet too high depending on what speed is used for best climb rate.
Either number is close enough for my purposes.

A little more clean-up still remains to be done but at this point, the Flight Model is pretty much done (again).

- Ivan.
 

Attachments

  • BV141B-Table511-Latest.jpg
    BV141B-Table511-Latest.jpg
    117.9 KB · Views: 2
High Altitude Instability

Hello All,

One of the things that made the Service Ceiling Test so difficult was that the autopilot could not hold the aeroplane at a constant attitude.
The aeroplane would constantly pitch up and down and the climb rate would oscillate over a fairly wide range with only minor signs of slowing down.

This kind of Longitudinal Instability in my experience is due to poor effectiveness of the Horizontal Stabilizer.

The first thing I suspected was that the area of the Horizontal Stabilizer (Record 1205) was too small.
(It was 75 feet^2.)
I pretty sure that I had scaled the dimensions from a rather imprecise drawing, so I thought I would go back and check against the Visual Model in Aircraft Factory 99.
(I don't know that my model is correct either, but it is one more data point.)

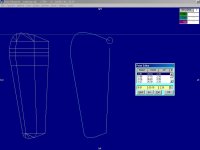
As can be seen in the first Screenshot, the outline of the Stabilizer is a Polygon with quite a few sides.
(I have traced the outline of the actual Parts and offset the outline to be distinct from the original Parts.)

The chord at the Starboard end is 5.25 feet and 2.89 feet near the Tip on the Port side. Span is 14.80 feet.
Approximating the shape with a Trapezoid and calculating the area gave 60.236 feet^2.

A couple years ago when my Son was in High School Geometry, he was working on a problem to calculate the area of a Triangle. It seemed to me that it would be reasonable to be able to determine the area of a Triangle through the lengths of its sides and did a search for a formula.
I found something called "Heron's Formula" at about the same time my Son found that he had misread the problem and that it was actually easier than we had thought, so all we did was use Heron's Formula to confirm his answer was correct.

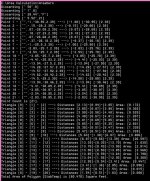
It occurred to me here that it was actually pretty easy to calculate the area of a multi sided polygon as long as it was Convex, so yesterday afternoon, I started working on a program to read the AF99 Parts (.afp) file and calculate the areas of all the Triangles from one Origin Point.

(Actually as long as all of the Triangles from one Origin Point do not overlap, it does not matter at all if the Polygon has multiple concavities.)

Last night I finished the program and the first complete run gave me
60.470 feet^2 as the calculated area of the polygon.
(See Second Screenshot.)

AreaHero == Area Calculation by Hero's Formula.
The Origin Point is highlighted in the screenshot and increment going counter clockwise.

So now, there is an interesting situation:
I had thought the H Stab area was too low in the AIR File.
It is actually most likely (from the information I have) to be too high, so by just correcting the area from 75 feet^2 to 60 feet^2, the Longitudinal Stability will get worse.
I can of course increase other factors to compensate, but the question is whether I should or perhaps the BV141B really did have poor stability at high altitude. I am not committing to any course of action yet.

In any I now have an amusing new tool to use in checking designs for AF 99.

- Ivan.
 

Attachments

  • BV141B_AF99_StabTemp.jpg
    BV141B_AF99_StabTemp.jpg
    36.9 KB · Views: 1
  • AreaHero.jpg
    AreaHero.jpg
    121.3 KB · Views: 0
A Few More Adjustments

After that last post, I thought about it a little bit and decided against changing any surface areas:
The 3D model itself is a very old one and was basically built by eyeball measurements rather than dimensional drawings.
Back when it was built, I could not find good drawings immediately and was in such a hurry to build that I did not spend the time looking for better drawings. There have been a few corrections over time, but even now, many other measurements other than the major dimensions are not verified.

Instead, I changed the Efficiency Factor in Record 1205 so that even with the same area, the Stabilizer would be more effective.
This fairly small change had a pretty great effect and sent me back to re-testing many areas:

The Trim settings are now quite different: The BV 141B now requires about twice as much Nose Down Trim at Low Altitude.
Directional and Lateral Trim are also significantly affected.

A spot check of Level Speeds showed no noticeable difference.
232 MPH @ 500 feet
276 MPH @ 15,000 feet

For the Climb Rate Test, Indicated Air Speeds were used.
Starting with Full Fuel, the Best Climb was over 1500 feet / minute and almost 1600 feet / minute between 125 MPH and 155 MPH.
With only Half Fuel, the Best Climb was over 1600 feet /minute between 130 MPH and 145 MPH and can be maintained up to 12,000 feet.
Climb Rate drops down to 1100 feet / minute by 17,000 feet.
Greater stability made the climb tests much easier.

The Service Ceiling Test was much easier with better stability.
33,134 feet was reached with 137.6 Gallons of Fuel remaining. (134.0 Gallons would be Half Fuel.) and IAS dropping to 129 MPH.
Climb Rate still appeared to be around 125 feet / minute but was varying quite a bit because of Longitudinal instability.
With a little less fuel and a little more patience, perhaps the Service Ceiling test would have gone up by another 200 feet.

Maximum Diving Speed of the BV 141B is listed as 550 KPH or 342 MPH IAS.
Testing of the flight model with a power dive from 35,000 feet gave a maximum of 472 MPH IAS but the aeroplane was shaking and out of control well before it drilled a hole into the virtual landscape.
The speed can be adjusted downward but I believe the Pilot should keep the speed below the limits from the operating manual.

- Ivan.
 

Attachments

  • BV141B_ServiceCeiling.jpg
    BV141B_ServiceCeiling.jpg
    32.4 KB · Views: 2
Instrument Panel

Hello All,

As can be gathered from the configuration of the Cockpit, the BV 141B had an unconventional arrangement of its instrument panels.
Some were in a row above the "Windscreen" and others were arranged on a console on the left side of the cockpit.

The attached screenshots show my attempt at representing cockpit instruments.
The row above the windscreen is the Main Panel and is generally accurate.
The left console panel has very little resemblance to the original and is basically a place to mount everything else I believed was absolutely necessary. Many of the real instruments have no CFS equivalent and are omitted.

Emphasis has been put on functionality.

I decided to show the left console by default because it contains gauges that are required for engine start, takeoff and setting cruise power and trim.

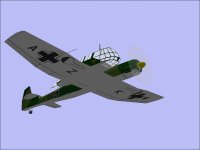
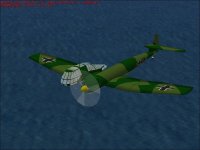
The external screenshot show a maximum speed run using the new Control Panel.
Note that speed is slightly higher than earlier testing because there is much less precision in setting Engine RPM without a digital test gauge.
(This was done without autopilot.)

- Ivan.
 

Attachments

  • BV141B_Panel_TakeOff.jpg
    BV141B_Panel_TakeOff.jpg
    82.1 KB · Views: 1
  • BV141B_Panel_Cruise.jpg
    BV141B_Panel_Cruise.jpg
    64.5 KB · Views: 1
  • BV141B_FlightTest.jpg
    BV141B_FlightTest.jpg
    51.9 KB · Views: 1
Released

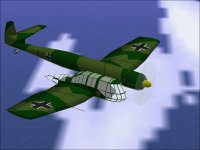
And it is finally finished and uploaded.

(I found a few spelling errors and I am sure there are a few others that I did not find.)

- Ivan.
 

Attachments

  • BV141B_RFHigh.jpg
    BV141B_RFHigh.jpg
    53.1 KB · Views: 1
  • BV141B_LFVeryLow.jpg
    BV141B_LFVeryLow.jpg
    59.6 KB · Views: 1
Hello Ivan,
Looks neat, practical and useful. What more could one want?
Cheers,
Aleatorylamp

I was actually going for a more complete set of Gauges, but had no success on a few things I tried.
The Panel Background is also a bit crude and I really don't know what I am doing with the configuration file either.
Now I need to go back and make a record of all the test data I collected before it gets misplaced.

- Ivan.
 
Back
Top