• Guest Please check out the Help Wanted thread in Ickie's NewsHawks.
    The future of the Outhouse depends on you!
    Help Wanted

Electro Power for small aircraft and drones

Hello Aleatorylamp,
Anna Honey just left for a trip today. I saw your prior post an hour or two ago just before Lunch but wanted to finish Lunch and start a load of laundry before sitting down at the computer. My Daughter is leaving for a trip tomorrow.

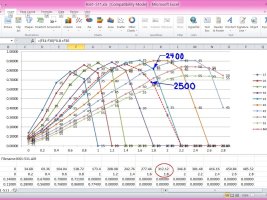
I was just about to tell you that you should take a better look at your two HP vs Altitude graphs.
One of the things you can generally rely on is that maximum speed at altitude is going to be pretty close to where the maximum engine power is achieved.... In other words, when you don't have a monster sized bulge in the middle of your HP vs Altitude graph, it will be at the Critical Altitude. There really isn't "Ram Effect" to be concerned about in CFS as I understand it.

Realistically, 17,500 Feet is not terribly high for a critical altitude. If you look at your two graphs that are posted here you will see that you don't seem to have higher HP readings before the Manifold Pressure peak and corresponding HP peak.

EDIT: In other words, your Critical Alttiude is still at such a low range that the bulge between SL and Critical Altitude isn't that great and you should probably just set Critical Altitude to be that at which the aeroplane was known to achieve its best speed.

As such, I suggest you INCREASE the boost for your supercharger just slightly until you get to 17,500 Feet or just below.
When you do, you will notice that if you move the Critical Altitude up to 17,500 Feet, the speed there will be too high by just a touch.
There are cool tricks to mess with that without messing with the Sea Level speed but it gets pretty tricky. Think Propeller Tables and CL Graph.
Look at the what Propeller Pitch is actually being used. I do not believe the range of 15 - 55 Degrees as on the P-51D is optimal for this little light aeroplane.

Enough for now, I have a few more chores before my Daughter gets home.
- Ivan.
 
Last edited:
Hi Ivan,
Wow! Thanks. I was going about it in the exact opposite way!

So, first I saw what happened with an increase in Boost Gain to 2.4, but Manifold pressure started dropping off after 15000 ft, albeit by less, so I had give more Boost Gain. With 3.0, at 19500 ft there was no loss at all in manifold pressure. I tried 2.7 and power started dropping off after 18000 ft.

Then I put in 2.6, and it seemed to be just right: At 17500 I got the highest Hp reading, 420 hp, with 38.7 Manifold pressure, which had just started dropping off.

Speedwise, now I had 451 mph at 17500 ft, and whittled my propeller efficiency graph down a bit for 40 and 45 degrees, as I saw the engine was using 44.3 degrees prop pitch. Then I also changed pitch range to 20-45. Now Speed is 441.4 mph at 17500 ft, which looks OK.

I also looked at S.L. speed, and found it had gone down to 371 mph, because of the lowered prop efficiency at 40 degrees. Here it uses 39.8 prop pitch, so I increased the 35 degree curve, and managed to squeeze out a bit more, to 377.2 mph. This may be plausible, and I don´t want to increase the 40 degree pitch curve because it will increase speed at 17500 ft, which is already at 441.4 mph instead of 440.

What also seems to have suffered a bit is the +400 mph competition mark I thought of transferring from the N333XT to this N777XT for Reno Stead altitude, which for 5300 ft now reads 392.8 mph with 369 hp. However, with the N777XT not being so souped up, this might still be within the scope of reality.

With 2.6 Boost Gain, the curve is now:
500 ft. 351 hp 38.8 MAP 377.2 mph
1500 ft 355 hp 38.8 MAP 381.9 mph
From here, there are 4 hp increases per 1000 ft,
16500 ft 417 hp 38.8 MAP 434.2 mph
17500 ft 420 hp 38.7 MAP 441.4 mph < C.A. Here Power Peak matches Speed Peak.
18500 ft 401 hp 37.1 MAP 437.2 mph

I´d say it´s looking quite good...

Cheers,
Aleatorylamp
 
Last edited:
Hello Aleatorylamp,
I believe that the propeller pitch angles you are posting are a pretty good indication that you have a mismatch of propeller to powerplant.
The propeller tables you are using seem to have too low of a power coefficient.
What are the advance ratios you are getting at your maximum speed runs?
I also believe that you are taking stabs at fixes without seeing the potential side effects.
Changing the efficiency was not necessarily a good idea to begin with, but you did that both ways if I recall correctly. You have tuned the numbers both UP AND DOWN. I wonder what the graphs actually look like now.

The Propeller Power Coefficient Graph and Efficiency Graph are supposed to match. If they don't you have some really funny things happen.
Think Perpetual Motion or an Aeroplane that can't finish its Takeoff Run like I had with the Ki-61 initially.

The most recent change is interesting. You had a very local problem in the table at 44.3 degrees and decided to change the series for 45 degrees which made some sense, but then WHY change the series for 40 degrees?
THEN you go change the series for 35 degrees because your earlier change affected SL speed....
Just about everything has side effects and the least change that addresses the issue is probably the best but it also helps to do some analysis as to where the problem is BEFORE you start changing things.
It would have made more sense to go back and undo your earlier change at 40 degrees once you figured out that it affected SL speeds.
It isn't so immediately gratifying when you try a bunch of things that don't quite work, but the problem with that is that you need to have a checkpoint / known good baseline to revert to when things start to go wrong.

Gotta Run. Need to go get some Dinner and try to do some more setting up of Game Machine afterward.
- Ivan.
 
Hi Ivan,
Thank you indeed once again for your suggestions and patience!

As some of the angles for each altitude in question lay between two columns in the propeller curve, I manipulated both the upper and the lower curve, but it looks like it´s solved now.
After lowering Boost Gain from 2.6 to 2.57, I observed that for 500 ft, CFS was using 39.8 degrees pitch, for 5300 ft, 41.1 degrees and for 17500 ft, 44.8. This seems to have separated things a bit better to reduce speed at 17500 ft, but not get such low readings for Reno Stead altitude and S.L.

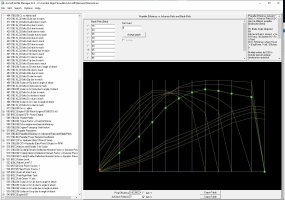
Now it was easier to regulate the 45 degree pitch curve by itself for 17500 ft, without needing to back it up with the 40 degree curve, and this left me good leeway to use the 40 degree curve to regulate 5300 ft performance. Then, I used the 35 degree pitch curve to try and improve S.L. perfomance abit, and it seems to have worked, although the graph layout looks a bit strange - the 35 degree curve actually lies between the 40 and 45 degree curve, but it works:

With 2.57 Boost Gain, and the new propeller efficiency adjustments, Performance is now:
....500 ft: 351 hp 38.8 MAP, 351 Hp, 389.8 mph, 39.9 deg. pitch < Plausible S.L. performance.
From here, 4 hp increases every 1000 ft, with MP steady at 38.8 in. hg.
..5300 ft: 369 hp, 38.8 MAP, 404.1 mph, 41.1 deg. pitch << Reno Stead +400 record performance, J factor 2.11.
16500 ft: 417 hp, 38.8 MAP, 438.9 mph, 44.6 deg. pitch
17000 ft: 420 hp, 38.8 MAP, 440.8 mph, 44.8 deg. pitch << Power and Speed peak.
17500 ft: 413 hp, 38.3 MAP, 440.8 mph, 44.8 deg. pitch << Speed peak maintains. Documented max. speed. J factor 2.29.
18500 ft: 394 hp, 36.7 MAP, 438.7 mph, 44.7 deg. pitch << Normal power fall-off after C.A.

J factor for this propeller at the speeds in question range from 2.11 to 2.29, and the propeller works because the last column is for a J factor of 2. Now I´m trying to free one or two columns be transferring data to previous columns to get a drop to zero after that, to avoid the Perpetumobile effect.

I hope this makes better sense now.

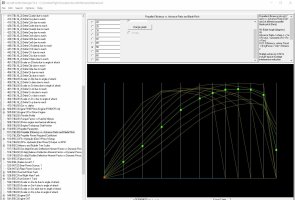
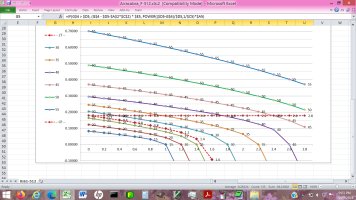
Attached is the prop efficiency graph table. Note that it is a 20-45 prop. The top graph is the 40 degree one. The second from the top is the 35 degree one. The highlighted one is the 45 degree one. The fourth from the top is the 30 degree one.
Making this graph have a column to drop down to zero has cause some slight changes around C.A. I have edited the list above and included a row for 17000 ft.

Bon Appetit for your dinner and good luck for the setup of your new Games Machine!

Cheers for now,
Aleatorylamp
 

Attachments

  • Prop_efficiency.jpg
    Prop_efficiency.jpg
    247.5 KB · Views: 4
Last edited:
Hello Aleatorylamp,
I just finished dinner today. I haven't bothered to clean anything from the table yet.
As for my Game Computer, I ended up going in back and disconnecting and reconnecting a bunch of things and that seems to have fixed a couple issues. I can actually run CFS there now though mostly with older aircraft. Newer projects are just gone. Hopefully they live on some flash drive yet to be found. I haven't even found a copy of FDE yet, though if necessary, I will just go find my AF99 CD and pull it from there.

EDIT: Just found a Zip archived copy of AbacusFDE from back when Abacus had it available as a download from their site. It was in my stash of archives along with a few hundred other flight sim related files, but not organized.

As for your project, I am not sure what originally generated your Propeller Graphs but from the appearance, there are some serious problems there. There are way too many inconsistencies and discontinuities. Did an automated tool generate this?
Note that the peak efficiency DROPS from 15 Degrees through about 30 Degrees and then goes UP again? Why?
Why is the spacing for Advance Ratios so irregular?
Other than the number of entries, this really doesn't look all that much like the Propeller Efficiency Table from the stock P-51D.

From the count of Advance Ratios, you Should already have a J=2.2 maximum which still isn't quite enough. I can't be sure though because none of the advance ratios are labeled. That is what it should be if the intervals are 0.2 apart as they are in most stock propeller tables.
I suggest you get the Propeller Tables better organized first before doing serious performance tuning. Otherwise, you will end up doing the same performance tuning over again. Just about ALL the tuning should be done with engine power and just accept that precision is no better than about 1% because just about every change has side effects.

By the way, Propeller efficiencies do drop to zero at some advance ratio but that is determined mostly by geometry.
You can do a pretty good estimate with simple trigonometry or looking at propeller efficiency graphs from an Internet search. The problem comes when WHERE they drop to zero doesn't quite match up with the spacing of the regular intervals of a propeller table. You can see that in the example I posted in the "Flying Swallow" thread. Also keep in mind that where efficiency drops to zero is where the power coefficient graph goes negative. Getting a slight mismatch in one direction is fine. Getting it wrong in the other direction and really cool things start happening.

- IVan.
 
Last edited:
Hi Ivan,
I hope you find as many of your projects and FDE as possible for your new Game Computer set-up!

Thanks for your comments, and for pointing out my mistaken decision of raising the 35 deg. graph. I had I wanted to raise S.L. performance separately from 5300 ft performance, but now I put the 35-deg. curve back in its place below the 40 deg. curve. To my surprise, S.L. speed. hardly suffered. From 389.4 mph it only went down to 389.1 mph, so obviously my maneuver totaly futilen, as I see the sim uses the 40 degree graph and not the 35 degree one. Anyway, with the slightly lowered Boost Gain, S.L. speed hasn´t suffered so much, and 389.1 mph is probably totally acceptable. So, one problem less!

You asked "Did an automated tool generate this?" - No, I did it by hand. Actually, the only automated tool I would use would be AirWrench, but it only works for CFS2 and FS2004. It has its detractors, but it works very well if you know how to use it. Anyway, it doesn´t apply to CFS1.

Then I continued looking for the 3-blade Hartzell prop diameter, but found no reference to 77 inches. I only found 75, documented both on the Hartzell page and on the Sharp Nemesis NXT page, so I put 75 inches back in.

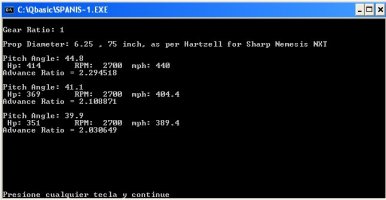
At S.L. CFS pitch angle selection went up from 39.8 to 39.9 for S.L., and J factor went up from 1.98 to 2.03. Reno-altitude J factor is 2.1, and 17500 ft altitude J factor is 2.29 as before.

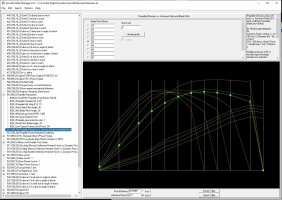
I had also freed one graph column to get the drop to zero on the right, (that´s why the graph spacing is irregular in some places). Now the 35, 40 and 45 deg. curves all peak on J factor 2.3, and drop to zero at J factor 2.5.

Maybe this is wrong, and perhaps I should free another 2 columns so that I can have the 35 deg. graph peaking on J factor 2 and the 40 deg. graph peaking on J factor 2.1?

Here is a screenshot of the new prop efficiency graph table, with the 35 degree curve highlighted.
I´d say it doesn´t look at all like the stock P51d prop efficiency graph table...

Also attached is a screenshot of the Qbasic J factor calculations. The Hp indications are just for reference and have no part in the calculation.

Cheers,
Aleatorylamp.
 

Attachments

  • Hartzel-3-blade-CV-prop.jpg
    Hartzel-3-blade-CV-prop.jpg
    34.8 KB · Views: 4
  • New prop efficiency graph table.jpg
    New prop efficiency graph table.jpg
    250.5 KB · Views: 3
Last edited:
Hello Aleatorylamp,
As I mentioned in the prior post, I found a download of FDE from Abacus from years ago. It was in my stash of flight sim downloads which are not organized and contain literally hundreds of files. I was actually looking for something else for a minor research project and just got distracted into looking at flight sim stuff.

Before we begin any further discussion on propellers, I STRONGLY suggest you find the "Flying Swallow" thread and download and PRINT the propeller efficiency graph that is one of the attachments. If you read and understand what you are looking at in that graph, it will save a lot of explanation. The only thing possibly wrong with that graph is that it may be overly optimistic for efficiency in some areas.
This may be bragging, but that propeller from Ivan's Propeller Factory worked quite well and predictably with no unexpected weirdness.
That is not to say that it cannot be improved because I know that it can.
Having everything in a spreadsheet makes the values very easy to manipulate and easy to check for consistency. I could raise or lower an entire range of numbers in a few seconds and see the difference in each pitch because each angle was a different colour.

As for your propeller, the diameter of 77 or 75 inches makes not a great deal of difference. The numbers change very little.
As for your propeller graph, there are many things that are not quite right about it. I don't know that they make a great deal of difference and if they don't bother you, then treat them as you want.
Fine pitch angles are useful when not moving or moving slowly because the propeller blade element is essentially a wing. It works best if the angle of attack is less than the stall angle. It will still move air even if the blade is stalled, but the amount of thrust generated for the amount of torque input becomes quite low (propeller is inefficient). The problem is that at fine pitch, pretty soon, the angle of attack becomes zero (actually the zero lift angle is what we are interested in) and the blade provides no propulsion at all. This is when efficiency drops to zero.
The finer pitch angles have a lower peak efficiency than coarser pitch angles up to about 45 degrees for fairly obvious reasons. This is NOT the case with your efficiency graph!

This zero lift angle can be estimated quite well by using advance ratio and that is how to predict the position of zero efficiency. The zero efficiency isn't there for convenience.

One other thing to note is that the simulator does not simply pick one propeller efficiency column to use (say 40 degrees) when the actual angle is something like 39 degrees. It does an interpolation for both advance ratio and for angles, so you are really using both 35 degree and 40 degree series. The problem is that sometimes the interpolation creates some rather unexpected effects and we need to alter one series or the other so that interpolation doesn't take a sudden jump in value.
Even without this issue, you have this sudden jump in values with your efficiency graph. What happens when propeller switches from 30 degrees to 35 degrees???
I believe that many of these discontinuities and odd transitions are being hidden because you have a very light aircraft with a fair amount of power but that doesn't mean the propeller tables are actually good.

- Ivan.
 
Hi Ivan,
Thank you once again for your interesting comments.

Well, at least the 75 inch diameter I found on 2 sites is not too different from the 77 inch one you mention for this plane.

However, more important was your comment about the inconvenience of the P51d´s CV prop with its 15-55 deg pitch range for the Nemesis NXT. As I found no reference at all regarding pitch range for the Nemesis NXT anywhere on the Internet, I changed this to 20-45 degrees, but you seem to still disagree, without however suggesting a better alternative.
I thought 45 deg. would be OK because the Beckwith Gauge showed that the sim didn´t need anything above 44.8 degrees, and now I have tried 15 deg. pitch, only to observe that the sim uses it for the first few yards of the take-off run, but I´ve left it in. Now I have pitch range at 15-45 deg., although probably the previous 20-45 pitch range was just as good. Anyway, I´d be interested to know what you would suggest as to pitch range for this aircraft.

Yes, as I said before, I have seen that my previous maneuver to improve S.L. performance by raising the 35 deg. curve was illogical and counter-productive, i.e. totally wrong and useless. Now this 35 degree curve is back in its place, and your explanation for why this is so, i.e. because of interpolation between graph columns, it makes all the more sense. So, that subject is now solved.

Regarding the jump you mention from 30 to 35 degrees. Do you mean this before or after I re-positioned the 35 deg. curve into its correct position?

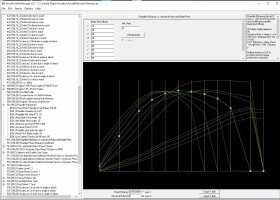
Another thing I´ve just done, is whittle down the peaks of the lower pitch angles so that visually they look more proportional to the rest, now that the 30 deg. curve is in place, its peak fits in a bit better now too. Also, I have shaped the finer pitch graphs a bit better to fit in more smoothly with respect to each other for the lower J factors.

Here is a new screenshot, with the 30 degree curve highlighted.

Observing the Beckwith Gauge, it seems that for varying rates of climb at full power, 21-30 deg pitch is used, as well as for level speeds below cruising speed with reduced throttle. Actually, there is no way I can check if the lower propeller pitch angles are correct, because all the pilot has to do is adjust the thrust lever to get what he wants - more than enough power is available.

You mention "The finer pitch angles have a lower peak efficiency than coarser pitch angles up to about 45 degrees for fairly obvious reasons. This is NOT the case with your efficiency graph!". Of course not! - I eliminated the coarser 50 and 55 deg. angles - I also saw that the sim never used them, but then why did you say the 15-55 Pitch range propeller from the P51d was so inadequate?

Regarding your suggestion about adapting the Flying Swallow graph table with a spreadsheet, is that I don´t know how to use a spreadsheet, so I have to do everything manually. Nevertheless, I´ll have a look at your Flying Swallow graph table.

Cheers,
Aleatorylamp

P.S. Should you be interested, I could attach the Nemesis NXT to a post. Just let me know, but you mustn´t feel in any way obliged to do so!
 

Attachments

  • Screenshot (271).jpg
    Screenshot (271).jpg
    245.5 KB · Views: 3
Last edited:
Hello Aleatorylamp,
Not quite sure why my old laptop is trying to heat up the entire room. I am not working it very hard at the moment because this browser is about the only thing running.

I will address some of your points first:
You asked why I did not suggest a better pitch range for your NXT propeller when you asked several posts ago.
My response at the time was to EXPERIMENT and see what angles it goes through as it gets airborne and reaches a reasonable flying speed.
If this bird stalls at 120 MPH, you probably won't care what the propeller is doing below about 125 or 130 MPH. I can't do these experiments and make these judgement calls. YOU CAN.

I suggested you look at the "Flying Swallow" Propeller Efficiency Graph BECAUSE if you did, you would see that although the Ki-61 had a maximum level speed below J=2.2 or 381 MPH, the graph goes up to J=2.8 or 485 MPH and even THAT isn't quite enough.
There is such thing as a dive, so ideally the graph should go up to the aircraft's VNE in TAS not IAS.

Your current Efficiency graph is better than the prior versions but if you take a close look, it appears to me that EVERY angle from 15 degrees through 35 degrees has the same peak efficiency.

If you look at the Efficiency graph from the Ki-61,
15 degrees - slightly under 0.8 at J=0.6
20 degrees - around 0.86 at J=0.8
25 degrees - around 0.88 at J=1.0
30 degrees - around 0.89 at J=1.2
After that, they are all at 0.9 or 0.91 or so from looking at the spreadsheet.....
UNTIL at 50 degrees, the maximum is only about 0.84.

The spreadsheet allows for some analysis and checks such as the dotted "Between" graph which is an interpolation.
It didn't appear as I had expected which is why I left it in as an illustration of problems.

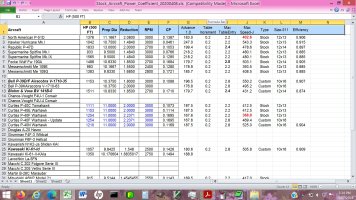
I have attached the Ki-61 graph for easier reference and also attached a power coefficient spreadsheet I found on my laptop.
Note that the power coefficient table for the P-51D doesn't even go up to the aircraft's maximum level speed. I am not quite sure what happens when the speed in the graph is exceeded.
Although we have only been discussing the Propeller Efficiency graphs, the real work was in revising the Power Coefficient graphs and those are very non-intuitive.

- Ivan.
 

Attachments

  • Interpolation.jpg
    Interpolation.jpg
    108.1 KB · Views: 2
  • Stock_Aircraft_{pwer_Coefficients_20200408.jpg
    Stock_Aircraft_{pwer_Coefficients_20200408.jpg
    1,018.4 KB · Views: 2
Hi Ivan,
Thanks, I appreciate the time and effort put into your last message. I did have a look at your Flying Swallow thread - it is rather extensive, and I remember now that I was following it quite closely at the time. I also saw the attachments in you posted tonight in that thread.

There are a couple of things that strike me: Your interpolation graph table shows 15 columns, but wherever I look, there are always only 12 columns available, not really enough to have an efficiency graph table with 0.2 deg. intervals include 2.4, 2.6 and 2.8 J factor columns without freeing a few more columns on the left in order to use them on the right. This also means that on the left the intervals are 0.3 and not 0.2, but I suppose that would be the way to go about it. Perhaps I am missing something, and there IS a way to add extra columns...

For the moment, my graph table has the S.L. J=2, the 5300 ft J=2.1 and the 17500 ft J=2.3 all engulfed in the J=2.3 column, after which they drop to zero together at J=2.5.

Another thing that strikes me on the other attachment, is that for speeds of around 400 mph between 1000 and 1500 Hp are needed, so the Nemesis NXT only having 350 Hp is making things very difficult, despite having less than half the Zero Lift drag that the warbirds have.

Then, there is another strange thing in my graph table. For J=2.3, the topmost curve is the 40 deg. curve, which is used for 5300 ft to get 404 mph, and at S.L. to get 389 mph, and needs a higher efficiency then the second curve down, which is the 45 deg. curve used for 17500 ft to get 440 mph. I expect the interpolation done by the computer must be quite strange. Then, the third one down is the 35 deg. curve.
Trying to fix this to make it look more logical, causes speed losses at 5300 ft, and at S.L.

Anyway, I´m going to try and get the crests to follow the pattern in your attachment.

Good night for now!
Cheers,
Aleatorylamp
 
Hi Ivan,

I have just done an experiment with CFS2 for the Nemesis NXT, given this aircraft´s "rarity" for CFS1 as regards its high performance with only a 350 hp twin-supercharged engine.

As CFS2 readily accepts my AF99 models, I wanted to see what kind of FD J.W. Beckwith´s AirWrench would generate. It seems that the "rarity" I mentioned above also applies for CFS2, but in a different way and more so. Although AirWrench accepts all specifications and required performance entries, the engine graphs and propeller graph tables generated seem sadly inadequate.

S.L. performance is a bit high, and Reno altitude a bit low - actually they look interchanged, and then, at 17500 ft, it is terrible, with only 353 mph. Also, Hp always stay the same at all altitudes: 350 hp at S.L. and 352 Hp all the way further up, even upto 17500 ft.
Being a different sim, perhaps it would need a different supercharge boost entry to achieve the specified speeds higher up.

Usually the AI in AirWrench is remarkably good at generating these graphs and graph tables, despite their unusual shapes. Even WWI warbirds come out nicely, but this is not the case for the Nemesis NXT. Could it be that at the end, this aircraft is too modern for the sims?

Anyway, coming back to the Nemesis NXT in CFS1, I don´t quite know how to get around the seemingly necessary higher 40 deg. propeller efficiency curve compared to the 45 deg. curve to keep performances correct, and for the time being, I have not been able to achieve any progress on this matter, although surprisingly, the plane seems to fly very well indeed !

Cheers,
Aleatorylamp
 
Hello Aleatorylamp,
I have been sending you a pretty fair amount of information but I don't think you actually understand what I am sending and why.
You might want to take a moment and look through the second attachment in my prior post and try to understand what each column in that spreadsheet actually means. Look especially at the record for the stock P-51D and see if anything stands out.
Another thing worth observing is the power of each stock aircraft at 500 Feet. This is where I took values to calculate Power Coefficient.
DO SOME RESEARCH!!!!
What is the actual Sea Level power of each aircraft IN REAL LIFE????

When I was seriously working on my Propeller Project, I wrote a bunch of utility programs.
ExtractRecord - Pulls a particular Record out of an AIR file and puts it into a separate file.
DecodeRecord - Translates the binary record that was extracted into a CSV format that could be loaded into a spreadsheet for analysis and editing.
EncodeRecord - Translates a CSV format text file into a binary AIR file record format
ReplaceRecord - Searches AIR File and replaces corresponding record with contents from a specified file.

Suggest you write something equivalent. It will answer a lot of questions. It will also make for faster editing if that is the route you wish to take. I believe that your current tool is inadequate and is hiding useful information from you.

FWIW, The power curves being generated in CFS2 are much better than what you were getting in CFS1.
In fact, that kind of a power curve is what you should be trying for.

As for the NXT engine, it really isn't generating a lot of power for the displacement.
My old Mustang was getting about 270 HP out of 302 cubic inches displacement naturally aspirated.
My Wife's Honda Accord with the base engine gets 192 HP out of a turbocharged 1.5 Liter (90 cubic inch) engine.
In the big scheme of things, 350 HP out of 540 cubic inches in a low revving engine sounds a lot like a small dump truck!

The NXT's claim to fame is that it is a nicely engineered kit sport aeroplane with surprisingly good 400 MPH level performance.

- Ivan.
 
Hi Ivan,
No need to shout... I´m afraid you credit me with a greater capacity of understanding in this matter than I really have, and I´m sorry to disappoint you, but I just don´t get it. I do appreciate your efforts in trying to make me understand what to do, but what you are getting at is quite beyond me, I´m afraid.

As it is, I´ve managed to get the desired performance out of the model with your help, something I couldn´t manage before, and for which I thank you very much indeed.

What I deduce from your attachments is that there are more columns in your prop efficiency graph table than the 12 columns available ones in CFS1 graph tables, and that the S.L. Speeds at 500 ft for the warbirds in your list almost all require over 1000 Hp - unlike the NXT, which has a rather high performance for a comparatively low engine power, which is not to be seen elsewhere.

Then, my research has not yielded some of the necessary information I´m lacking, e.g. Nemesis NXT´s S.L. top Speed and max. manifold pressure, the twin turbo superchargers´ volume compression ratio, or for that matter, the specific NXT engine model certificate - only similar Lycoming engine certificates are to be found. There is so much data missing that I don´t know which of the listed engines could be similar.

So once again, I´m sorry - all this goes over my head, and I´m sorry to disappoint you, but I´m going to let the matter be. My insight is not enough and I´m quite out of my depth for more profound investigations and experimentation.

Thanks very much again,
Cheers,
Aleatorylamp
 
Hello Aleatorylamp,
Please download and PRINT a copy of the second attachment in my earlier post as I will refer to it a lot in this message. It has an awful lot of information and I was actually answering the questions you were asking by supplying the data in that spreadsheet.

First of all, NONE of the stock aircraft can achieve 400 MPH at Sea Level. * NONE! *
The other fact worthy of note (research!) is that the Hurricane Mk.I is the only aircraft with engine power close to its historical level at Sea Level.
The Spitfire Mk.IX also has power that is close but it doesn't count because M$ uses parameters in the AIR file to simulate a 2,000 HP Rolls Royce Griffon engine instead of the proper Rolls Royce Merlin. For a Griffon engine, it is about 450 HP too low at Sea Level.
This is pretty consistent across all the other aircraft.
The P-51D is 200-300 HP too low.
The P-47D is about 200 HP too low.
The Spitfire Mk.I is about 100 HP too low.
The FW 190A is 250 HP too low.
The Me 109E is 150 HP too low.
The Me 109G is 100 HP to 400 HP too low depending on which version they wanted to represent.

Are we starting to see a PATTERN here?
The point is that for engine power to be a bit low at Sea Level is not unreasonable.
Most people never bother looking at the horsepower being generated but they DO look at the speed being reached.

Now go back to the printout and READ COLUMN K.
When you understand what that means, READ COLUMN L!!!

As I stated much earlier, you are just not reading and understanding the information I am sending to you.
If you go down to row 25, it gives a pretty good description of the parameters of the Ki-61 aircraft along with a description of the propeller efficiency table.
This is actually not the first time we have been here.
If you look at row 11, you will see a pretty familiar Airacobra project.
I was trying to guide you through building your own propeller for the Airacobra you were working on.

If you are curious as to whether or not this concept works, download any of the Airacobra I built.
I recommend the D model with the 37 mm cannon. It has the most interesting flight characteristics.

The last thing to comment on is what Zero Lift Drag Cd0 actually is.
It isn't an absolute number. It is a coefficient. Its drag value is determined by multiplying against the size of the aircraft.
Ideally it should be the flat plate area (frontal area) of the aircraft but generally that is not information that is easy to come by, so most of the time, it is multiplied with Wing Area.
The NSX is a much smaller aircraft than any of the stock fighters. Compared to the P-51D, the NSX has a 70 square foot wing while the Mustang has a 233 square foot wing.

Hope things make more sense
- Ivan.
 
Hello Aleatorylamp,
Do you remember that a couple posts back, you stated that wherever you looked, you were always getting 12 columns for the Propeller Efficiency Table? Did you notice that the stock P-47D actually has 13 columns?
I also suggested WAY back that you calculate the propeller power coefficient of your engine / propeller setup and select the appropriate or closest matching aircraft for a propeller.
The propeller power coefficient for your Nemesis NXT is 0.097889.
It only took a few seconds to calculate and now you can compare that number to those of the stock aircraft.

- Ivan.
 
Hi Ivan,

Before reading your last two messages, I had done something that I wasn´t doing before with the Prop Thrust Required graph table, because I thought it would completely ruin my power envelope, however flawed that was, the reason being that its 40 deg. graph was giving me the correct 350 Hp for S.L. and the Hp for Reno Altitude, although the corresponding prop efficiency curve needed a lot of enhancing - which was the problem.

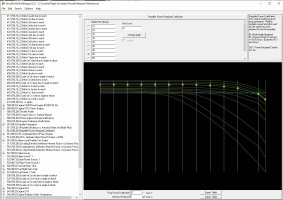
Anyway, I looked into the Propeller Thrust Required graph table and saw that the 40 deg. graph was not crossing the zero line at J=2.3 like in the Prop Efficiency graph table, but considerably later, and that the 45 deg. curve was crossing the zero line correctly.

So, I adjusted the 40 deg. curve to do so, and then brought down the excessively high 40 deg. curve in the efficiency table, to have it peaking at 0.9 and did some more adjustments so that there would be more harmony in the graph shapes, matching the peaks as in your diagram.

I also fit the 45 deg. graph a bit better, although the latter was better left untouched, as now 17500 performance is too high, but I can adjust that.

Surprisingly enough, Horsepower for S.L. and Reno altitude stayed the same! That was quite unexpected, although performance is a bit on the low side for S.L. and Reno altitude, but I can adjust that better now.

Regarding your last post, it is clear that none of the warbirds can achieve 400 mph at S.L., and neither can the Nemesis NXT. It is also clear that the +400 mph is for Reno Altitude. My problem was the oddly high 40 deg. prop efficiency curve, but I have been able to start working on it.

As you said, it was a matter of the Power Coefficient for that Pitch Setting, but it took some time for me to understand that.

Columns K and L are still quite cryptic to me, but your comment on the NXT Prop Coefficient being 0.097 is a good piece of data I can now continue working with. Thanks very much. It does look like the Nemesis NXT is more efficient than the warbirds´ Prop Coefficient.

Thanks very much again for your patience and time.
I will re-read your recent posts and see if I can understand them better.

Update: Something rather strange has happened: The sim progressively started asking for more and more coarse pitch angles, so I had to re-instate the 50, 55, 60 and 65 deg. pitch angles one after the other, fitting them into the propeller efficiency and the thrust graph tables.
Slowly everything started to click into position more logically, with progressive adjustments to the different thrust and efficiency graphs.
I also had to free another column from the left, to use on the right.
Now the J=2.1 column is separated from the J=2.3 column, which separates performance for higher altitude and S.L./Reno altitude.
The visual result is in the attachments, with the 50 deg. graph highlighted.

Preformance at the three main reference altitudes is now much more correct, as can be seen as follows:
Sea level (500 ft): 351 hp, 38.8 in.hg., 43.2 deg. prop pitch, 387.6 mph.
....Reno (5300 ft ): 369 hp, 38.8 in. hg., 47.0 deg. prop pitch, 406.8 mph (the N333XT no-ADI Reno Record).
................17500 ft : 414 hp, 38.3 in. hg., 60.4 deg. prop pitch, 440.4 mph (documented N777XT top speed).

At last, results look much more professional!

Slowly I´m starting to think that perhaps this aircraft may be good and interesting enough to upload into the CFS1 library...

Cheers,
Aleatorylamp.
 

Attachments

  • Screenshot (272).jpg
    Screenshot (272).jpg
    217.3 KB · Views: 2
  • Screenshot (273).jpg
    Screenshot (273).jpg
    232.6 KB · Views: 3
Last edited:
Hello Aleatorylamp,
If I understand correctly from your attached images, I believe you need to go back and READ the actual title of Record 512.
It isn't Thrust Required, It is POWER Required COEFFICIENT. Your terminology had me confused until I looked at the attached images.
In looking at the shapes of the curves in that table, I believe you have taken out a major feature of constant speed propellers.
Those curves are a LOT more complicated than they first appear.

Let me ask you to try this:
Take your aeroplane up to an altitude of 5,000 Feet at a speed just above stall.
Now slow down the simulator so that you can observe what is happening before it flashes by.
Push Throttle to full power.
Observe the Propeller Pitch and Thrust readings to see how they change.
What happens as the aeroplane goes faster and faster? Is that correct?
What is the governor on a constant speed propeller supposed to do?
How are your curves different from those in the stock aircraft?

I never stated the Nemesis NXT propeller was more efficient than that for the typical warbird. That is not what Propeller Power Coefficient measures. It measures how hard a propeller is to turn or how much power it can absorb. My table only shows what the values are at a particular altitude (Sea Level). Since we cannot fly at Sea Level, I take a power reading at 500 Feet for consistency purposes because it won't differ by much. The air density (Rho) used for the calculation is for Sea Level.
I KNOW all the airplanes in the simulator can reach 500 Feet altitude, so it is a good place to take power readings.

If you take a look at the numbers, you will see that the P-47D has a lower Power Coefficient than the others. Why?
It is because it has a big a$$ propeller that is bigger than necessary at low altitude.
By the time you get to 30,000 Feet, Other aircraft will have lost a substantial portion of their engine power, but the Thunderbolt is just getting happy. Thunderbolt hasn't lost all that much engine power and with the thinner air, it has a propeller that can actually take a bite and use that power.
The Propeller Power Coefficient can also be calculated up at 30,000 Feet, but of course will give much different results because both air density (Rho) and engine power will have changed. Many of the stock aircraft would be struggling to reach 30,000 Feet, so it isn't a great place to test. The Airacobra would take about a month to get that high if it got there at all.

Does this make sense?
- Ivan.
 
Hi Ivan,

On second thoughts... Perhaps the more I think that my .air file is getting better as regards power vs. altitude is concerned, in reality it may be getting worse all the time, so maybe I still haven´t got the point you are making about all the stock aircraft being very low on Hp but not on speed at S.L., and it turns out that this whole power train it still on the blink and totally erroneous.

At first I thought you were implying that the stock aircraft FD were all badly written, but now I perhaps it´s the other way around, that I should give the NXT much less Hp at S.L. too, keeping speed up though, and that perhaps 350 Hp should really be for 5300 ft Reno altitude. This sway Hp at S.L. would be reduced to around 330 Hp, and 17500 ft to perhaps 394 Hp, of course with speeds as they are now.

So... What does the twin turbocharger do in the NXT engine in reality? Does it maintain 350 Hp from S.L. to 17500 ft throughout, or would it slowly increase Hp as air got thinner, similar to the High compression German Aero engines with their gated throttles? The problem is that unlike other aircraft, there is nothing to be found regarding the typo of supercharger used on the NXT.

I´ll have to look and see if there is information Turbocharger on the Piper Aztec that you mentioned a while back.

With the supercharger at 38.8 in. hg. as you were saying: "It is basically a 6 cylinder 540 CID engine putting out about 350 HP at quite a bit under 40 inches Hg", we see that power rises with altitude for a Boost Gain which puts Critical Altitude at 17500 ft.

So, it will obviously need less max. Manifold Pressure if we were only to maintain 350 Hp all the way to critical altitude.
BTW, what is "quite a bit under 40 inches Hg"? Maybe lower than the 38.8 I have now... 37, or 34 maybe?

A message seems to have just arrived from you. Let´s see....

Update:
I just read your last message.

Yes, sorry, Power required, not thrust required.... and no, I don´t know what is missing from my propeller tables.
I thought the drop to zero was in order, whereas stock aircraft all have the right side of the efficiency graphs sloping down gently like what a wave has behind its crest, not dropping to zero.

This is getting more and more complicated all the time. I thought I was getting somewhere, but it seems to be the contrary, and I am getting nowhere fast. I thought it was a good sign with the prop governor selecting coarser angles than before as speed is gained.

As I already said yesterday, it´s getting much too confusing and frustrating for me, I´m afraid. I should have stopped then, but at least today the graphs seem have a better shape now, unless of course they don´t, and all this is a big load of manure, which I won´t upload under any circumstance.

I´m throwing in the towel.

Thanks for trying to help, but I´m always misunderstanding everything, sorry.
Cheers,
Aleatorylamp
 
Last edited:
Hello Aleatorylamp,
NEVER Throw in the towel!!!!

I know I am getting frustrated a bit and unfortunately, I am letting it show in some of these messages.
The information is out there. The information is here as well. I believe that part of the problem is that you don't have a systematic way of developing a flight model. There is nothing all that out of the ordinary with the NXT and its engine and propeller.

I have attached a screenshot of the Power Coefficient Table from My Airacobra to this post.
I believe it illustrates a couple of the points I was trying to make. Note the shapes of the curves for each pitch angle.
There are two dashed Red Lines in the graph.
One is an interpolation between two angles to show that the curve is still shaped reasonably. I believe it is at 27 Degrees.
It is the line that is curved downward and crosses the Zero axis.

The other line is much more interesting.
It is a Horizontal line which represents a given Power Coefficient.
Note that as the Advance Ratio increases, the line gradually crosses several Pitch series. WHAT DOES THAT MEAN?
It means that as speed increases, the Propeller Pitch gets coarser to optimise to the forward motion (Advance Ratio).
This is the part that is missing from your Power Coefficient graph.

Note that on a very primitive level this is exactly what we did back with the propeller for the Condor only in that case, the pitch change was only between two angles and it was intentionally abrupt.

Some things are not easy and may take a while to get right. The Airacobra flight model took me about 6 months of experiments and failures before I got something I was satisfied with. The end result was that I learned A LOT about some of the workings of AIR files though I am sure I didn't get everything I actually wanted. There was some data I simply could not find.
Download my Airacobra, see if my claims for how the propeller works are overrated.
Experiment with it.

- Ivan.

Airacobra-PowerCoefficientTable.jpg
 
Hello Ivan,

I don´t know what you mean.

After describing your horizontal red dotted line at zero that crosses several pitch series you say: "This is the part that is missing from your Power Coefficient graph."

This is simply not true. If you look at my Propeller Power Required graph table you will see a blue horizontal line at zero that crosses all the individual graph lines for each J factor, and that means that gradually, with speed, a higher advance ratio is used. Proof of that is that in the sim, the governor works, selecting a coarser angle as speed builds up. So, I just don´t understand what you mean.

The only difference in general between your and my Power Coefficient Graphs is that my Power Coefficient graph is more horizontal towards the left, just as the graphs in ALL the stock aircraft, and all that this really means, is that it supplies more power at lower RPM, and is probably done on purpose in CFS1, probably to facilitate engine startup.

Interpolation is also possible between all the graph curves in my graph table. Proof is that it is also working in the sim.

So, as I said before, I simply don´t see what you are getting at.

Two of the main questions are left unanswered: a) whether it is correct for Hp to increase upto critical altitude and then drop off, or should Hp be maintained the same throughout and then drop off. The problem is that the sim needs more horsepower at altitude to maintain performance, and b) a convenient blade pitch range for this 3-bladed CV propeller - I have found no angle numbers anywhere on the Internet. In the sim, of course, anything can be made to work: 20-40, 20-45, 15-45, 15-50, 15-60, 15-65... Nobody anywhere quotes any specific numbers.

Anyway... Such is life.

Update: Oooops! There IS something crucial I forgot and still have to do: The points where the efficiency curves drop to zero don´t match the points where the power coefficient curves drop to zero, as I moved the columns on the left in the efficiency graph to free some columns for use on the right. This created a mis-match between the two graph tables, that I know is an important factor, and simply forgot to correct, and this still needs to be fixed.

Cheers,
Aleatorylamp
 
Last edited:
Back
Top