Electro Power for small aircraft and drones

Good morning, Ivan,
Thanks for your post.
You mention:
>I downloaded and installed your Hubris HXT as "Nemesis" on my Game Machine.
>I figure whenever a release version comes out, it will get overwritten.
Well, that´s why I wanted to delete the Hubris HXT from Post #66 because it was only meant as a vehicle for the Hubris Proof of Concept exercise, the .air file being irrelevant because it would get another one anyway but I can´t find the option to delete attachments anymore, I know it existed before, so now I´m landed with it and that model is redundant.
What would really only be to the point is attaching my Nemesis model and .air file, but that would clutter things up even more.

You mention:
>... at 17,500 Feet. I got 434 MPH which is much lower than what you are getting.
How strange, there seems to be a difference between my computer and yours. This is not the first time I have seen strange differences with someone else.
You also mention:
>The model enters the simulator at too steep an angle and the damping on the tail wheel is too low.
OK, I´ll look into that.

Update: I´d completely forgotten about the Dp file of course! Now I´ve put one in, without any bombs or guns, and only got a marginal speed increase of 0.4 to 0.7 mph depending on altitude, but no change in Hp.

My model doesn´t include ADI, as that option seems not to have been standard for all Nemesis NXT models, but the N333XT record breaking machine had it, and depending on the weight category it was competing, the ADI tank was taken out or left in. I believe they even took out the flight computer and achieved a higher record.

In the spec sheet for the sale of the NXT777XT, amongst the equipment installed listed, ADI is not mentioned, but it does mention 440 mph at 17500 ft. Then, on the official Nemesis NXT site, the 407 mph record for 5300 ft for the N333XT without ADI would apply to the the N777XT too. There is a mention of a 416 mph record, but I´m not sure if it is with or without ADI. The category definitions are a rather confusing.

You mention:
> Of course, to stay under MTOW with the ADI system installed and two passengers, you can't carry full fuel.
Yes, I agree. So, my weight calculation is: Empty weight 1600 lb, One Pilot: 200 lb, Oil: 60 lb. = 1860 lb, and I still have to fix the Dp file.

In Post #78 you mentioned
>I would suggest multiplying the POWER COEFFICIENT table values for 45 degrees by 1.02 (increase by 2 percent). That would be after you have gotten the engine power down a bit at 17,500 Feet.
OK, but I haven´t been able to get the power down for that altitude. Nevertheless I multiplied the POWER COEFFICIENT table values for 45 degrees by 1.02 (increase by 2 percent), with negligible improvements - of course, as I have to get power down a bit first.

Another thing: My Nemesis NXT has a tendency to dive that I missed after over-correcting the strong tendency to soar it had. A better setting in record #1101 Primary Aerodynamics "Pitch Moment Coeff. ad AoA=0" would be -6.

Have a nice Sunday.
Cheers,
Aleatorylamp
 
Last edited:
Hi Ivan,
Just a short note: Today I finally got my CFS1 to identify and load your "Hubris Warhawk" - there was some gauge that prevented the aircraft from appearing in the aircraft index, and it took me time to I realized this, but using my panel own now, I can fly it and see its behaviour on my computer.
My objective was to compare the performance of the plane on our two computers, given your report of a lower speed than I was getting.
The model attached has Cd0=16 and no further tweaking of the 40 deg. curve, and the performance summary posted was with slight changes done after attaching the model, with Cd0=18 and some tweaking in the 40 deg. curve. This would affect the entire flight envelope unfortunately, making a comparison meaningless, I´m afraid.
Anyway....
Cheers,
Aleatorylamp
 
Hello Aleatorylamp,
I just spent the last couple hours messing with flight simulators.
Some of it was trying to figure out what was going on with your NXT. Part of it was setting up something to edit AIR files on my laptop. Although I have AirEd downloaded on the laptop, it is a slightly earlier version and doesn't take the same AirEd.ini file. Eventually I ended up pulling the version from the Game Machine and everything seems to be working. I still can't get FDEditor to work and I am pretty sure the laptop is clean. The program simply does not behave like its documentation says it should. It reminds me of AF99. It was not working at all until it was patched. You have to wonder about folks that sell software on CD without even verifying that it works. My Son tells me that is how the current game industry runs today.

Now, on to the NXT.
I tried a tuning idea and it didn't work quite as well as I thought it would. I could not take the power at 17,500 Feet down below 415 HP without reducing the Sea Level power. Eventually, I decided to tune down the supercharger. I reduced the boost from 2.65 which works with the other engine parameters on my version but doesn't seem to do so well with yours to 2.57. The side effect is that although we now get 401-402 HP at 17,500 Feet, the actual maximum power is 415 HP at 16,500 Feet. From what I can tell on a not so thorough test, it does not appear to go any faster below 17,500 Feet even though HP is higher. Speed is still only 435 MPH though which is not surprising to me since that is what I got with the same power with my version of Hubris HXT.
Next step is to get a power versus altitude table, calculate Power Coefficients and see where the simulator is actually working with each table.
This may not happen tonight though. I am still chasing an image editor for the Game Machine. The version I like will not install there.

Just out of curiosity, where did you get your data for the TIO-540 engine?
I found a TCDS which lists specifications for a great number of them. Seems like critical altitude goes anywhere from 12,000 Feet to 20,000 Feet. Most make slightly less power at altitude as they do at Sea Level and maximum power is generally in the 340 HP to 350 HP range. I found this on my phone while eating lunch.

Time to start thinking about Dinner.
- Ivan.
 
Last edited:
Hi Ivan,
At the moment I´m not using FDEditor with my "new" supercomputer from 2018 I got a few months ago from my younger Daughter. (I like the way you use capitals).
AF99 doesn´t work at all in Windows 10 unless it is virtualized with Windows XP, but no problems, I can fire it up in 10 seconds, work on it, e.g. to .zip a file, save to a shared disk, access it with Windows 10 - it´s really cool. My AF99 CD version doesn´t need any patches.
AirEd is easier for me to use than FDE, and for the graphs I use AAM.

OK, the NXT: Now comes the exciting part: It appears that great minds think alike...
I decided I would try and bring down power by reducing Boost Gain.
First I tried Boost Gain 2.5, (tweaking the graphs too - slightly lowering the entire 45 deg. power coefficient graph and raising the 45 deg. efficiency graph J=2.2 and 2.4 to get enough power, and although I got 388 Hp at 17500 ft with 440.5 mph, Boost Gain at 2.5 was too low because there was a power surge at 15500 ft with 413 Hp and speed surge at 16500 ft with 443 mph. Anyway, At 18500 everything dropped a bit. a bit.

So, I decided to go for 2.57 Boost Gain (what a coincidence !!!). I had to re-tweak the 45 deg. power coefficient graph back up again, and lower the efficiency graph for 45 deg. pitch around J=2.2 and 2.4 a little bit. Lo and behold, I got 403 Hp at 17500 ft, with 441 mph and now there is a speed/power peak is at 16500 ft with418 Hp and 442.1 mph. At 18500 ft everything dropped a bit.

I like this one much more, and will try to get it 1 mph down at the peak and above.
500 ft: ----- 351 Hp, 385.9 mph, 39.5 Hg, 47.5 pitch
5300 ft: ---- 370 Hp, 408.9 mph, 39.5 Hg, 40.4 pitch
14500 ft: --- 408 Hp, 434.6 mph, 39.5 Hg, 43.8 pitch
15500 ft: --- 413 Hp, 438.1 mph, 39.5 Hg, 44.3 pitch
16500 ft: --- 418 Hp, 442.1 mph, 39.5 Hg, 44.7 pitch < power and speed peak here
17500 ft: --- 403 Hp, 441.0 mph, 38.3 Hg, 44.7 pitch
18500 ft: --- 384 Hp, 439.3 mph, 36.7 Hg, 44.5 pitch

But...why is speed so low on your computer with my version?

I just re-looked up the Engine specs on Wikipedia, and have just seen I got a typo :oops: in my .air file: I had 90.15 cu. in. per cylinder instead of 90.25! The NXT doesn´t appear anywhere, but it a similar one with 300 Hp and 8.7 compression is the IO-540-K1A5.

Then there´s also the very confusing TYPE CERTIFICATE DATA SHEET NO. E14EA which doesn´t contain the -NXT either.
Just now I´ve discovered the TIO-540-EA2A Operating manual, and it states 7.3:1 compression instead of my 8.7:1... o_O
So perhaps between one thing and the other, it evens out! :unsure:

I also saw the critical altitude varying between 12000 and 20000 ft depending on the model on the Lycoming page, but none was the -NXT...
One source says it is the Thunderbolt TIO-540-NXT Aerobatic engine but that page doesn´t give any specs. It is all rather confusing.

The Official Nemesis NXT page doesn´t go into technical details on its engine/s either, but mentions all its progressive records over the years.

The description of the N777XT can be found by entering Nemesis N777XT Aircraft.com in the browser.
I think we have to play it by ear and simply see what fits the CFS1 model best.

Well, I´ll send this off before it gets any later. More tomorrow!
Good night, (and good evening to you!)
Cheers,
Aleatorylamp.
 
Last edited:
Hello Aleatorylamp,
I believe your signature line might be bringing you bad luck.
"Why make things simple when you can make them complicated?" Hmmmm......

I believe you have a serious misunderstanding of what the Propeller Power Coefficient graph actually does.
It is a means of determining what the proper Propeller Pitch is to match the Engine Power, Rotational Speed and forward motion.
If you RAISE the points for the 45 Degree series, what you are saying is that you want to need more forward speed or more engine power to get to 45 Degree pitch angle. You are changing the way the propeller governor selects the pitch; you are NOT affecting actual engine power.

The reason I like FDE more than the other AIR file editors is because you can define multipliers in the Control File. The value for Cd0 is a decimal. It is represented in the AIR file as an integer so when you see the value 20, it really means Cd0 = 20 / Something. That can be defined in FDE but not for other tools. The 20 does not give a sense of any kind of meaning. A decimal value can be compared against documented values from actual aircraft.

I did a fair amount of testing and tuning of your NXT AIR file.
I ended up decreasing Cd0 to 16 and increasing the supercharger boost slightly.
Here is the current power versus altitude table:
500 Feet ------- 352 HP --- 39.5" -- 390 MPH -- 37 Degrees
2500 Feet ------ 359 HP--- 39.5"
5000 Feet ------ 368 HP--- 39.5"
7500 Feet------- 378 HP--- 39.5"
10000 Feet ----- 388 HP--- 39.5"
12500 Feet ----- 398 HP--- 39.5"
15000 Feet ----- 409 HP--- 39.5"
17500 Feet ----- 404 HP--- 38.4" -- 440 MPH -- 44 Degrees
20000 Feet ----- 358 HP--- 34.5"

Normally I would not bother tuning any further. The Nemesis actually will hit 441 MPH but takes about 5 seconds longer than I usually allow on a speed run. Then again, I don't have a stopwatch handy as I usually do.
If I wanted to get that extra one MPH, now is the time to tune the Propeller graphs.

- Ivan.
 
Hello Aleatorylamp,
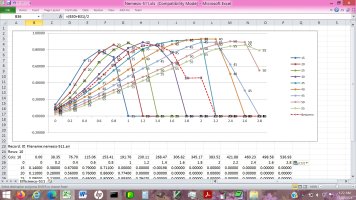
Attached is a spreadsheet of the Propeller Efficiency graph from the NXT.
I was wondering a bit about the flight performance of NXT in which 422 HP gives 441 MPH and 402 HP gives 440 MPH.
In a simple description, this graph is massively broken. I suggest you discard it because it will take more effort to fix it than simply start over if the engine power is more or less correct. I haven't looked at the graph of Power Coefficients yet.

The obvious broken areas are the Red dashed line which represents 32.5 Degrees. Note its behaviour.
This is the curve that will be encountered if the propeller switches between 30 Degrees and 35 Degrees.
The efficiency curve for 35 Degrees is too wide and drops suddenly which causes an interpolation problem. The efficiency curve for 40 Degrees is a bit too wide. The efficiency curve for 45 Degrees is too low and drops too fast. There is no reason the 50 Degree curve should drop that fast past the peak.
This graph explains why there seems to be a clustering of pitch angles at 44 Degrees. There is a serious efficiency drop at 45 Degrees and as Advance Ratio increases, efficiency drops so fast that the aeroplane simply cannot accelerate any faster in level flight.

I am sure the original Propeller Efficiency graph had some issues, but they were minor compared to what I just listed above.

- Ivan.

Nemesis-511-Broken.jpg
 
Hi Ivan,
Wow! Good Heavens! I must thank you again for your explanation/s, efforts and help all along this exercise.

So, the Propeller Power Coefficient graph actually determines what proper Propeller Pitch to use, to match Engine Power and J factor.
I must get my mind around this, despite my brain fog. I see what you mean about my graph shapes, what their clustering effect means now, their defective interpolation and why the 50 degree should not drop to zero.

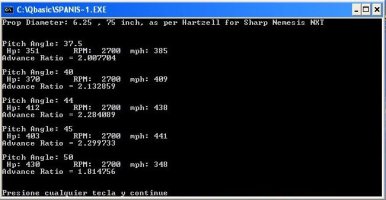
My problem seems to be trying to fit existing 35, 40, 45 and 50 degree graph columns for use with J=1.815, 2.132, 2.284, 2.299 factors, i.e the interpolation problem.

Attached is a screenshot showing some of the angles and J Factors needed at present. Hp is only a reference, not in the formula.
Of course this could vary after correcting Cylinder capacity to 90.25, compression ratio to 7.3, and raising Boost Gain so that Critical Altitude is at 20000.

Update: ... or maybe I´ll keep Compression Ratio at 8.7:1 because Thunderbolt Aerobatic TIO-540-NXT engines were more souped up. They weren´t standard engines, but specially built for the Nemesis NXT racer. Some even had 380 Hp, but not this one.

There is another thing from the Official Nemesis NXT site, which I find so confusing.
Their N333XT Reno Stead records are average speeds for 3 and 15 km race courses, done with non-ADI because of the weight category, and so, not only does the 406 and 407 mph records apply to the 15 km course, but also the 415 mph for the 3 km course. Then they mention 435 mph was attained at some point during the race (not average). This must be the 5-minute peak T.O. power mentioned somewhere else. They also say that with ADI they had a computer and an ADI tank sitting on their passenger seat, which they took out for the Record flights.

From the 2016 and 2015 press releases on the Official Nemesis NXT Internet Site:
>Quote<
As a recap, there were two weight categories, C1b (1,102 - 2205 lbs) and C1c (2205 - 3,858 lbs) that Sharp challenged during Thunder Over Moriarty Speed Blast in Oct . 2015. As a summary, the New World Speed Records are 3 km C1b at 393 mph (old record was 388.5 mph), 15 km C1b at 405.9 mph (old record 378.7 mph), 3 km C1c at 415 mph (old record 390.5 mph), 15 km C1c at 407 mph (old record 376.2 mph) and 100 km C1c at 397.2 mph (old record 364.2 mph).
>Unquote<
>Quote<
This speed was derived without any ADI (anti-detonation injection) and the engine cylinders and oil were running cool as if the the engine was waiting for more throttle! What is more astounding is the top speed Jon reached in the 15 km run was 435 mph at the very end of the record run. He did slow down in the middle of the last run to avoid a flock of birds.
>Unquote<

Now, on the N777XT page they say it is a two-seater, capable of 440 mph at 17500 ft. I suppose this would be coherent with the non-ADI peak performance of 435 mph at Reno Stead?
Here we seem to be talking about 5-minute max. throttle here, and I see your point of having WEP implemented.
Normal throttle range could be upto 415 mph, and WEP upto 435 mph at Reno altitude. Let´s see if 440 mph at 17500 ft then
automatically falls in place.

About the 1 mph, I was really looking for 1 mph less, not more, sorry!

Very interesting, your current power vs. altitude test results.
Putting in Cd0 at 16 seems to be quite acceptable then. I was more used to values of 40 upto 120.
AirEd seems to divide it by 2048 to get the real Cd0 value.

Now, I must really see how I can draw the graphs to fit the J factors without clustering or having a huge step in the interpolations.

Have a good Monday!
Cheers,
Aleatorylamp
 

Attachments

  • Jfactors.jpg
    Jfactors.jpg
    44 KB · Views: 3
Last edited:
Hello Aleatorylamp,
I was reading your post as I was having breakfast and thought it necessary to let you know you are again going about things in the wrong direction. It seems like one major problem is that you do not have an understanding of the domain and what the raw data is telling you.
Do you remember way way back when I told you that if the record was 416 MPH, you should really be tuning for at least 420 MPH?
If it is a closed-circuit course (meaning there are turns to complete the course), the actual straight-line speed will be considerably higher than the lap speeds. Look at Formula 1 racing and their speeds on the straightaways as compared to lap speeds. In NASCAR stock car racing the difference in speed in the straights may be about 20 MPH higher.

Our original discussion was about what I thought the Manifold Pressure was for the standard TIO-540 engine use in a typical kit plane NXT. I had seen something indicating numbers just under 40 inches Hg. Yes, I know that the TIO-540 is one of Lycoming's Thunderbolt specials.
The question becomes what the likely specs and performance would be. I already stated pretty early on that I doubted that Jon Sharp used a regular engine for his speed runs.
So if you were Lycoming, what would YOU do to improve the power of a custom Thunderbolt engine that you knew was to be used for record attempts? Raise the compression??? That doesn't really work. The power gain is very small and limits the amount of supercharging that the engine will take. Think effective compression. Remember the Daimler Benz DB 605? Did you know that it had different compression between the left and right banks of cylinders? The DB 605 had the supercharger offset to one side so that the centerline had room for a motor cannon. That in combination with probably a fair amount of valve overlap made the effective compression between the banks equal.
Engines with greater supercharging tend to have lower physical compression so the effective compression doesn't blow up anything. Note that the Merlin had 6:1 compression.

I would not be surprised to find out that Sharp was using an engine capable of well over 400 HP at Sea Level for his speed runs. As for Manifold pressure, we know from TCDS on other TIO-540 that some can get to 44 inches Hg without mention of ADI. Now Sharp found it necessary to use ADI in some attempts. What does that tell you?

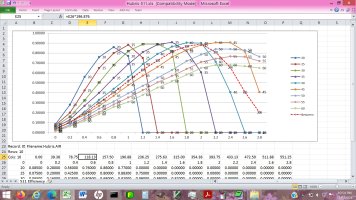
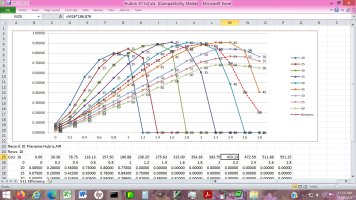
As for Propeller Efficiency tuning, I have attached the before and after graphs for my original Hubris HXT which was derived from a P-40N.
As you can see, it wasn't a wild, blast everything kind of approach. The actual important tuning was fairly minor and was aimed at an Advance Ratio slightly above 2.20.
Note that even with this graph there is a problem. The interpolated line for 42 Degrees does not go quite as high as those for 40 Degrees or for 45 Degrees. That is the price we pay for using the CFS Propeller system. It isn't perfect. We just try to make it close.
Note that the maximum efficiencies for some of the finer pitch curves was lowered slightly as well. It didn't affect the current issue but looked like it was appropriate.

Figure out what the problem is before trying to implement a solution.

- Ivan.

Hubris-511-Faulty.jpgHubris-511v2.jpg
 
Hi Ivan,
Thanks very much for your comments. They are a great help. Let´s see if I can grapple more effectively with the situation now.
Yes, slowly I understand a little more, and can see the problem with my graph tables. The shape of your graph tables is clean, without clustering. I must try to do that myself.

I haven´t done anything further - I was trying to decide on the slight Boost Gain increase to use to get closer to the Power Table in your post #85. Possibly from 2.65 to 2.655. With 2.7 there is already far too much power at altitude, so I´ll see.
I will also put back the original, well shaped P39d propeller graph tables, and try and work on those without spoiling things.
I won´t just copy your Hubris Warhawk propeller tables, because my engine and friction graphs are different, and if I copy those too, then I´m not learning anything, so there´s no point.

Another question is the Manifold Pressure to use. I think for now I´ll leave that at 39.5 because raising it too much (44 in. Hg) will cause too much power higher up. If Jon Sharp sometimes needed ADI for his already souped up engine, maybe his supercharger wasn´t the most powerful, but it was stronger than the one on the more off-the-shelf N777XT´s engine.

Updated Paragraph:
So, can the speed objectives for the N777XT rely on the N333XT´s record speeds? Given the description of speed runs along the race course, this would invalidate the 416, 409, and 407 mph Reno records for possible N777XT Pylon racing marks, but maybe they would be a valid guide-line for straight-line maximum speed marks for the less souped up the N777XT max. speed at Reno altitude.
The 435 mph straight line speed mark at the end of N333XT´s racing run would of course be invalidated for the N777XT.
Then, S.L. performance could maybe be plausible anywhere between 375 and 390 mph I suppose, and only the 440 mph at 17500 ft can be believed, and if anything between 404 and 416 mph comes out for Reno altitude, it would be OK.

Re. Compression ratio: I see... so 7.3 is correct for the Turbocharged TIO-540-NXT because 8.7 was used on the fuel-injected, un-supercharged 300 Hp IO-540-K1A5. ... One problem less!

Well, let´s see what happens now.

Cheers,
Aleatorylamp
 
Last edited:
Hello Aleatorylamp,
I believe you are reading things that I did not say.
I never stated that the NXT used an engine with a critical altitude of 20,000 Feet. Higher is not necessarily better.
What I actually observed was that different models of the TIO-540 had critical altitudes anywhere from 12,000 Feet up to 20,000 Feet.
IF the engine on NXT had a critical altitude of 20,000 Feet, then Dan Wright would have done his speed runs up at that altitude and not at 17,500 Feet. I figure if the speed run is at 17.5K, then the engine critical altitude is about 16.5K to 17K.

As for Propeller Graphs, there is no reason I can think of that the Hubris graphs won't work for NXT as well. One of the things I was wondering about was why you picked the pitch range of 21.5 - 51.5 Degrees. You know how interpolation works. It is never good. At best, it is just not terrible, so if you do not have pitch range data, why do you pick number that will cause trouble?
There is nothing actually special about Propeller Graphs fo Hubris. They are just lightly modified P-40N and although you don;t have the latest, the changes are in the message above.

Edit: Oops, I almost forgot to mention - I did some calculations a while back with angles and their AoA at various Advance Ratios with the standard measurements of a propeller blade at 75% radius. I also found that experimentally, the numbers being quoted were about 5 Degrees off from my pure estimates based on geometry. This is because the typical propeller blade is not all one angle and when one part is stalled, another may still provide a slight amount of propulsion. Here is what I arrived at and it seems to match up pretty well with what graphs I have seen at aeronautical sites.
Blade Pitch versus Advance Ratio at which it drops to Zero Efficiency
15 Degrees 0.9
20 Degrees 1.1
25 Degrees 1.4
30 Degrees 1.7
35 Degrees 2.0
40 Degrees 2.4
45 Degrees 2.8 or 2.9
50 Degrees 3.3 or 3.4
55 Degrees 4.1
60 Degrees 5.1

This is why you should not try to force the series to zero efficiency.
Geometrically, it does not make sense.

Time to get some Lunch.
- Ivan.
 
Last edited:
Hi Ivan,
Bon Apetit!
No, not to worry - I know you didn´t say CA was 20000 ft, but that the TIO-540 engine types had CA´s of 12000-20000 ft.
At first I thought I should set Boost Gain for CA to be 20000 ft but soon discovered that was no good.
You mentioned "I figure if the speed run is at 17.5K, then the engine critical altitude is about 16.5K to 17K." I´ll try to adjust Boost gain for that then - slightly higher than 2.65.
Pitch range 21.5 - 51.5 Degrees was in the Airacobra, and I left it in because the Airacobra was very effective at low altitudes. I didn´t know it would cause trouble, but I´ll readily accept the Hubris propeller pitch range.
If you think I should better use the Hubris propeller graph tables and not the Airacobra ones, I´ll do so. :)(y)
Thanks for the Blade Pitch versus Advance Ratio at which it drops to Zero Efficiency, that is valuable information.
Must get to bed sooner.
More, tomorrow!
Cheers,
Aleatoprylamp
 
Hello Aleatorylamp,
I was just setting up a few things to pull the Propeller Tables from Airacobra to use on the NXT.
I found I did not have the latest copy of the Airacobra AIR file on my old laptop. In fact, I may not have the latest copy at all.
I pulled the copy from my Game Machine which is 0.51. It is probably good enough for what I am doing. The repository for my projects was my Development Computer which is dead.

Use either set of Propeller Tables that suit you. I was going to try the Airacobra tables just to see if it made a difference. I do not expect any significant differences, but it would be interesting to see if I run into the same issues you did and if some of my recommended solutions work as expected if those problems arise.
Personally, I believe the Airacobra was a much more thoroughly examined flight model than any that I had done before it because I spent so much time on it and had to change so many things.

We shall see what happens.
- Ivan.
 
Hi Ivan,
The Airacobra I got the other day for the propeller was P-39DEJ_050.zip from the SOH library, just FYI, so perhaps it is a prior version to the 0.51 you mention just now, but they look very clean and proper.
A comparison between the Airacobra´s propeller tables and Hubris Warhawk´s ones for this project will no doubt be interesting.

You said:
>I believe your signature line might be bringing you bad luck.
>"Why make things simple when you can make them complicated?" Hmmmm......
I agree! I should change that now after so many years.
I was thinking about "If it ain´t broke, don´t fix it", but that doesn´t really apply, as in this case, sth. can be faulty but apparently work...
"Keep it simple" is no good either, as that could mean using default CFS1 Propeller tables.
"Not all that works can´t be made better" sounds like criticism to others, and greater ability that I don´t have.
AH! "NEVER throw in the towel!!" from your post #59 sounds to the point!

Sayings can be interesting, even if you make them up (but they aren´t saying really, but so what?). My Father use to say, "Who says the lion doesn´t eat lard?" and my Mother never knew if he had made it up or got it from somewhere. I suppose it means "Well I´ll be darned.".
Then my Brother said once "No good deed goes unpunished". I liked the smug sarcasm involved...

Anyway, Propeller Tables:
For the moment, and for the sake of effectivity and work efficiency - "Why not use it if it´s better" - I will put your Hubris Warhawk´s propeller tables into my grey/dark red Nemesis Hubris HXT model here and put in the values from your Post #88 to observe their behaviour, and keep the Airacobra tables on the yellow/dark blue Nemesis NXT for further experimentation and comparison.

More, later!
Cheers,
Aleatorylamp
 
Last edited:
Hi Ivan,
Interesting findings and results: This new .air file certainly has much cleaner propeller graphs!
Working with your Hubris-Warhawk .air file you attached to Post #74 in my Nemesis-Hubris Warhawk-model, I found a Boost Gain of 2.657 marginally better than 2.65, giving slightly lower speeds (0.1 - 0.4 mph) below critical altitude and slightly higher values above that.
It was also better than 2.7 or 2.8, as these would give slightly higher power and speed values beyond critical altitude.
I tweaked the propeller efficiency table here and there as per the graph V2 attached to Post #88 as well as I could, and then fine tuned the curves a bit more during the tests. I also got the 399 mph at S.L. down a bit (you mentioned that too), with the corresponding graph with J factor for the 77 inch propeller. So here are the main results, showing numbers for the main reference points and around critical altitude.

500 ft ---- 350 Hp --- 387.5 mph --- 39.5 Hg --- 35.9 pitch
5300 ft --- 364 Hp --- 409.2 mph --- 39.5 Hg --- 37.9 pitch
16000 ft -- 398 Hp --- 440.7 mph --- 39.5 Hg --- 42.2 pitch
16500 ft -- 400 Hp --- 441.0 mph --- 39.5 Hg --- 42.4 pitch
17000 ft -- 401 Hp --- 441.3 mph --- 39.5 Hg --- 42.5 pitch
17500 ft -- 403 Hp --- 440.6 mph --- 39.4 Hg --- 42.6 pitch
18500 ft -- 389 Hp --- 440.1 mph --- 38.0 Hg --- 42.5 pitch

I also corrected the landing gear problem, and left the WEP-2 in just for fun, and here is the new .zip file attached - .air file only, in case you are interested.

The next thing I´ll do is to put the Airacobra´s graph tables into my Nemesis NXT, and try to tweak those decently a bit, and then see how that compares to this.

Well, dinner time now!!
Cheers,
Aleatorylamp.
 

Attachments

  • Hubrshxt.zip
    3.8 KB · Views: 1
Last edited:
Hello Aleatorylamp,
We got back in the house only about an hour ago. Anna Honey got back from her trip earlier today. I saw one of your posts this morning but it was on my phone and I did not have any of the data that I wrote down last night to refer to for a reply.
As for version numbers, the one that is uploaded here is the latest. The version of the upload is 050, but if you check the last line in the description in the AIR file, you will get a version number for the AIR file. The next field which is supposed to be a description, but which is actually not displayed is what I usually use to describe what the changes are that were made in a particular AIR file version.
The prior version of the AIR file was 0.50B. There were both 0.50A and 0.50B versions that were testing out different ideas to resolve a problem. The 0.50B turned out to be the better solution, so 0.50A was discarded. They were concurrent versions so both were 0.50.

Last night, after my prior post, I swapped the Propeller tables in your NXT AIR file with ones from my version 0.51 Airacobra.
Here are the results with Cd0 = 16.
500 Feet ------- 351 HP -- 39.5" -- 362 MPH -- Propeller Pitch 35 Degrees
5000 Feet ----- 368 HP -- 39.5" -- 381 MPH -- Propeller Pitch 37 Degrees
16800 Feet ---- 417 HP -- 39.5" -- 462 MPH -- Propeller Pitch 45 Degrees - This is Critical Altitude
17500 Feet ---- 404 HP -- 38.4" -- 461 MPH -- Propeller Pitch 45 Degrees

It is fairly obvious that I can tune the performance in any direction I like but I don't know what the actual goal is.
I believe 461 MPH is a bit too high but what should it be? 381 MPH at 5000 Feet seems a touch too low but I also don't believe it should be 407 MPH either.
Consider this: If any average NXT could achieve this level of performance on 350 HP on a fairly plain TIO-540 engine with an off the shelf propeller, then Jon Sharp's speed records would have lasted maybe 6 months after he sold his first NXT kit. That obviously didn't happen.
Anyone who buys and puts together a NXT probably has at least a million dollars to spend. The typical TIO-540 engine is several hundred thousand dollars and I imagine a custom Thunderbolt version is even higher.
I believe we are really discussing two different and differently equipped aeroplanes here. Dan Wright's plane probably wasn't quite standard and may have had some equipment changes to make it faster at high altitude but wasn't a low altitude screamer like Jon Sharp's plane was.

You decide what the performance goals should be and we will see what can be done.
I was thinking when you were contemplating different sayings. If I had to put in a signature line, it would be:
"As Good as I can Make it."
No claim of perfection or even of a particular level of quality. Just promising the attempt with the best work I am capable of.

- Ivan.
 
Hi Ivan,
Good morning, after a cup of tea... I learnt to use multi quotes...
We got back in the house only about an hour ago. Anna Honey got back from her trip earlier today. I saw one of your posts this morning but it was on my phone and I did not have any of the data that I wrote down last night to refer to for a reply.
No Hurry - none at all!
As for version numbers, the one that is uploaded here is the latest. The version of the upload is 050, but if you check the last line in the description in the AIR file, you will get a version number for the AIR file. The next field which is supposed to be a description, but which is actually not displayed is what I usually use to describe what the changes are that were made in a particular AIR file version.
Yes! It is indeed version 050 with 0.51 in the last line of the description.
I believe 461 MPH is a bit too high but what should it be? 381 MPH at 5000 Feet seems a touch too low but I also don't believe it should be 407 MPH either.
Well... 440 mph for 17500 ft, as is mentioned on the site describing the yellow and dark blue N777XT, would be correct to use, so there´s no doubt about that. Then, 350 hp at 500 ft would also be correct for a not-quite-off-the-shelf engine, and I would think the 387.5 mph I got in the Hubris-Warhawk would be OK.

Update:
Sorry: Before, I had somehow missed your comment "381 MPH at 5000 Feet seems a touch too low but I also don't believe it should be 407 MPH either" even though I quoted it!😞
As the N333XT low-altitude screamer got to 435 mph max. at the straight end of a Reno Race, averaging 407 and 416 mph depending on the 3 or 15 km pylon race courses, then the more-conventional-but-not-totally-off-the-shelf N777XT would not reach these figures, but nevertheless, as you deduced, it could reach reputable and appetizing speeds, which I´d say a straight line speed must have been above 400 mph, specially as we don´t mean an average for a pylon race course. Wouldn´t at least 405 mph be more correct?

"As Good as I can Make it." sounds good too, but it is not as dramatic as "NEVER throw in the towel !!"

So... Now for some toast with green olive-oil and salt, and some more tea...

Update 2:
Re: Airacobra propeller graph tables in the Nemesis NXT:
With the unaltered Airacobra propeller graph tables, Hp was altogether too low, and speed too low lower down and too high higher up.
After correcting for 350 Hp at 500 ft, speed is now still too low lower down and even higher than yours higher up. My critical altitude coincides with 17500 ft, possibly because of the 2.657 Boost Gain, and the wide spectrum makes things rather difficult...

500 ft ---- 350 Hp, 365.4 mph, 39.5 Hg, 36.0 pitch
5300 ft --- 368 Hp, 391.0 mph, 39.5 Hg, 38.3 pitch
16800 ft -- 415 Hp, 471.7 mph, 39.5 Hg, 45.9 pitch
17500 ft -- 418 Hp, 476.0 mph, 39.5 Hp, 46.4 pitch < C.A.
18500 ft -- 400 Hp, 473.5 mph, 38.0 Hg, 46.2 pitch

Anyway, now I´ll get the J Factors to see how things must continue.

Maybe lower CA first, to get power down a bit...


Cheers,
Aleatorylamp
 
Last edited:
Hello Aleatorylamp,
A Motto is not necessarily supposed to be dramatic, but it should at least be truthful.
That is all that I was going for.

As for recalculating Advance Ratios, shouldn't you have a listing handy?
This is something that isn't going to change. I did one for your Nemesis days ago when I started looking at it.

On my first try with the unmodified Airacobra Propeller tables, I found that the speed at 17,500 Feet was much higher but the speed down low was much lower. I decided to look into it a bit and found that the Propeller Efficiency graph needed a little tuning. It would not change the efficiency for any of the series of angles to any noticeable degree but it WOULD help with the interpolations and switches between different angles.
That actually didn't quite work out. The low altitude speed only increased by about 10 MPH, so I decided to look a bit further.
Turns out that the Power Coefficient graph needed significant work. The power coefficients of NXT were very low for he speeds that were being reached, so the "Propeller Governor" was not switching when it should have been. I had to actually remember how to use the tools I had developed years ago to get things behaving better.
After doing a few propellers, I think I am starting to understand the ideas a lot better though some of the math I was using a couple years back looks pretty undecipherable today. It looked so obvious when I was doing the programming.

End Result: (Cd0 raised to 17. Also dropped supercharger boost just a touch.)
500 Feet ------- 351 HP -- 371 MPH -- 395" -- 38 Degrees Pitch
5000 Feet ------ 368 HP -- 402 MPH -- 39.5" -- 40 Degrees
16600 Feet ----- 416 HP -- 455 MPH -- 39.5" -- 45 Degrees <----- Critical Altitude
17500 Feet ----- 400 HP --453 MPH -- 38.1" -- 45 Degrees

Thia ia where I believe the numbers should actually be.

- Ivan.
 
Good morning Ivan,
I saw your message last night when we got in from the cinema but by then I had run out of energy and wasn´t lucid enough to answer.

I remember a pun from Mad Magazine eons ago: "We eat what we can, and what we can´t, we can." Thus, another motto along these lines to put in some pun humour: "I do what I can, and what I can´t, I can."... but how often does one change a signature line? ...

The Warhawk derived Propeller tables seemed to be easier to work with for this plane than the Airacobra ones now.
Getting the 330 Hp at 500 ft up to 350 was easy, by adjusting either the Torque or the Friction graph, but then, several different things I tried out to increase 5000 ft performance and decrease 17500 ft performance just wouldn´t work. What you have managed is very good indeed to say the least. Lower down, speed is a bit lower than with the Hubris-Warhawk .air file, and higher up, the excessive performance is now significantly reduced.

So, in view of these results, which Propeller Graph Table option would be more convenient to use? The Warhawk or the Airacobra derived ones, I wonder, although I´d be inclinde to use the Warhawk ones...

More, later!
Cheers,
Aleatorylamp
 
Hello Aleatorylamp,
I am about to head out the door and won't be back until this evening. I thought I would take a couple minutes to address what you just brought up and something that you may have forgotten.
You are not actually working with the P-40N Propeller tables. You are working with the Hubris Propeller tables. I already took what came from the P-40 and adjusted them where necessary to work with Hubris. The NXT is a nearly identical aircraft to Hubris, so pulling a propeller from Hubris is expected to work.
As you can see from my last post, with a bit of tuning (a little more than I had originally expected) the Airacobra's propeller actually works just fine with the NXT as well. The main reason for the tuning is that both the Power Coefficient and Efficiency curves that NXT encounters were not encountered by Airacobra because it is significantly slower. (About 80 MPH slower at Sea Level.) The Advance Ratios are pretty comparable.

Tuning Propeller Tables isn't all that difficult, but you NEED to know what you are doing.
Now figuring out the really cool tools I wrote a few years back to help in doing all this is fairly difficult.

- Ivan.
 
Hi Ivan,
Just to clarify the possible confusion: I know that one can hardly call it "work", copying the values in Post #88 into the Hubris Propeller Efficiency Graph picture V2 with AAM into the .air file. The only issue was the graphic resolution of the image on the print-out which made it difficult to see exactly what height the points on the curves were on, needing a bit of flight testing and fine tuning.

So no, I didn´t do any work on the Warhawk-derived tables of course, because you had done that already. Then, from your comments, I got the impression that the Airacobra-derived tables were going to need more work, which in effect, as you said, they did. Very interesting, the reason for this.

Thank you for all your explanations!

Now what I have to do is try and obtain the same results for my NXT as those in your Post#97, so that I can learn something.
After that, I have to decide which of the two .air files to use.

So, cheers for now,
Aleatorylamp
 
Back
Top